Patch vs. Workaround: How CVEs Actually Get Fixed

Patch vs Workaround- How CVEs Actually Get Fixed hero
Diogo Ferreira
Written by Diogo Ferreira
Manager, Vulnerability Research
Nicholas Salesky
Written by Nicholas Salesky
Vulnerability Researcher
Nuno Lopes
Written by Nuno Lopes
Sr. Vulnerability Researcher (emeritus)

Introduction

In order to collect various security-related metrics, Bitsight scans the entire internet, collecting a unique set of data that enables us to carry out a variety of studies that would be extremely difficult for any other company to conduct.

One of the metrics that we collect is related to the presence of certain vulnerabilities. For this, we need to take into consideration all possible mitigation strategies that are available and that allow us to reduce the risk.

When a vulnerability is disclosed, besides patching, the vendor can sometimes suggest a workaround that will also mitigate the risk. In these cases, a simple version comparison isn't enough, we need to interact with those systems in a specific way that would allow us to safely detect any mitigation that has been applied and determine their vulnerability status. This also allows us to determine which type of mitigation was applied, whether patching or a workaround, which gives us insight into what mitigation strategies companies are using for different CVEs, on different products, across different sectors.

At the end of 2024, Bitsight TRACE started analyzing all the vulnerability data collected throughout the last 18 months for a set of selected vulnerabilities to determine the “Patch vs. Workaround” trend.

This blog post focuses on the analysis of CVEs and the industry's approach to fixing security issues, whether through patching, implementing a workaround, or both.

Understanding modern vulnerability management: A deep dive into critical CVEs

In this blog post, we will perform an in-depth analysis of six Common Vulnerabilities and Exposures (CVEs) to understand how companies are defending against these vulnerabilities. Specifically, we will compare two primary mitigation strategies: updating to a recent version of the software (patching) versus applying a modification to the existing vulnerable version (workaround).

To conduct this analysis, we selected several vulnerability detection methods that rely on actively probing for a specific CVE instead of using those that are based on version checks. These probes interact with the target systems, triggering specific responses and/or behaviors that allow us to determine whether they are vulnerable, have been patched, or if a workaround has been applied. By doing so, we can accurately assess the mitigation strategies employed by different organizations.

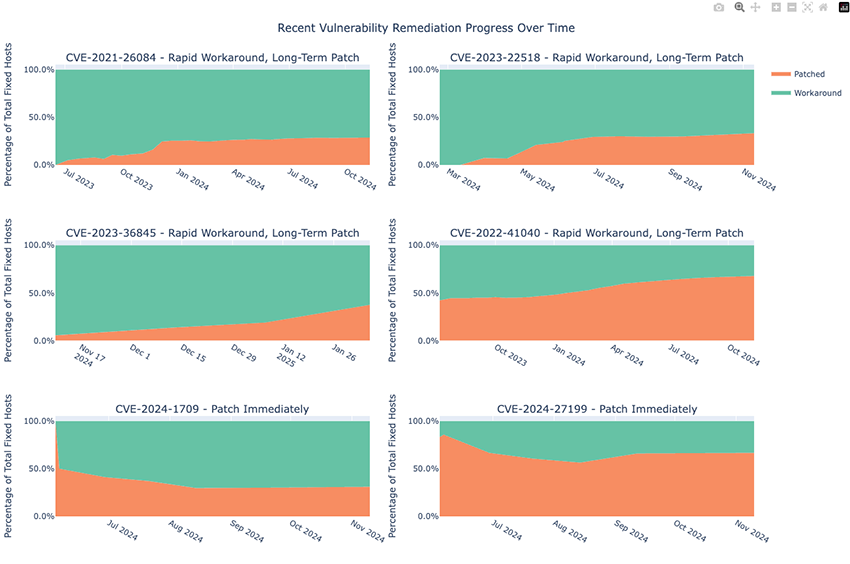
We have categorized the CVEs into two groups: recent vulnerabilities and older vulnerabilities. This categorization allows us to observe any differences in mitigation strategies over time.

The CVEs we will be analyzing are as follows:

Product CVEs

Atlassian Confluence

CVE-2021-26084, CVE-2023-22518

ConnectWise ScreenConnect

CVE-2024-1709

Microsoft Exchange Server

CVE-2022-41040

JetBrains TeamCity

CVE-2024-27199

Juniper JunOS

CVE-2023-36845


By covering multiple products and analyzing these CVEs, we aim to provide valuable insights and statistics on how companies defend against vulnerabilities. This analysis will help us understand the effectiveness of different mitigation strategies and identify any trends in vulnerability management.

Dissecting CVE-2022-41040: Insights into the Microsoft Exchange Server exploit

CVE-2022-41040 is a Server-Side Request Forgery (SSRF) vulnerability. This flaw allows an authenticated attacker to remotely trigger another vulnerability, CVE-2022-41082, which permits remote code execution when PowerShell is accessible. These vulnerabilities are known as ProxyNotShell, which enables attackers to execute arbitrary commands on the affected Exchange Server, potentially leading to complete system compromise.

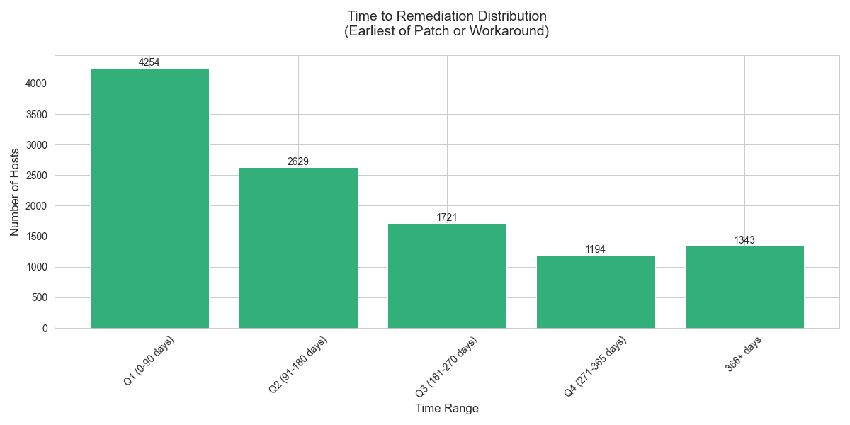
To understand how CVE-2022-41040 remediation was addressed, we examined data from Internet-wide scans conducted from July 2023 to December 2024. These scans evaluated whether hosts remediated the vulnerability through patching or workaround. In total, we detected 44,180 vulnerable systems. Of these, 11,141 systems were remediated at some point.

The time to remediation distribution highlights important patterns in how the vulnerability was addressed across different timeframes:

time to remediation distribution

In the first 90 days, we saw the highest remediation activity, with 4,254 hosts addressed, showing a strong initial response following the vulnerability disclosure. However, the significant drop to 2,629 hosts in the next quarter (91-180 days) suggests that after the initial surge, fixing the remaining systems becomes much more challenging.

What's especially noteworthy is that 1,343 hosts, about 12% of all remediated systems, took over a year to implement fixes. One of the many reasons for this may be the fact that, given its nature and importance for the business, companies are likely to consider Exchange Servers as part of their critical infrastructure, and the patch management process in place for these is much stricter, requiring several tests and not allowing it to be done all at once. Also, considering how widespread Exchange Servers are, some versions are too old to be updated, so patching may not even be an option. This pattern demonstrates that while security maturity varies widely, the biggest challenge lies not in identifying vulnerabilities but in the organizational capability to respond effectively.

vulnerability remediation progress over time

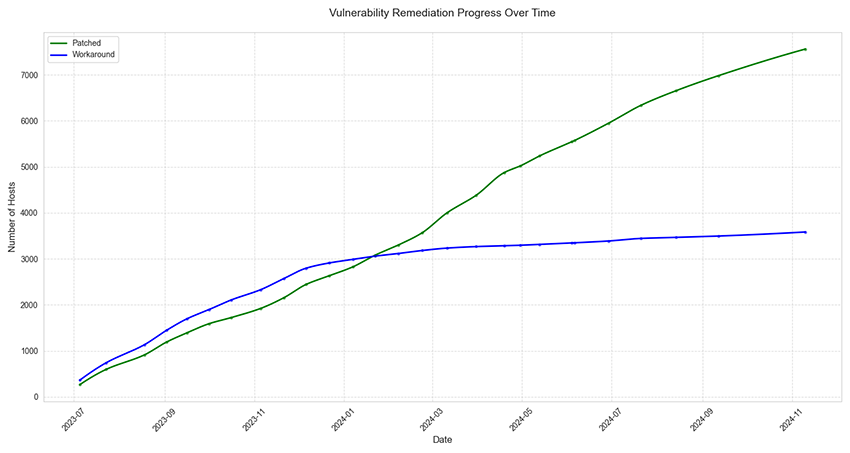
From the timeline of accumulated remediation detections, we can observe that initial remediation efforts began slowly in July 2023 but gained momentum by late 2023. A notable divergence between patching and workaround approaches emerged around January 2024, with organizations increasingly favoring complete patches over temporary workarounds. By the end of the observation period, approximately 7,500 hosts had been patched, while roughly 3,500 had implemented workarounds.

Many organizations initially implemented temporary workarounds but later transitioned to full patching. This shift aligns with best practices for long-term vulnerability management. This approach reflects a commitment to not just quick fixes but also to sustainable and comprehensive security measures.

Examination by industry sector

Since Exchange was such a popular product, we had the opportunity to analyze how different industry sectors compared in remediating the same vulnerability. Pulling from our proprietary firmographic data, we were able to categorize 6,237 remediated instances out of 44,180 total instances into 23 defined sectors of various sizes. There were 4,904 instances which did not pertain to a known organizational entity. Sectors ranged in size from 3,278 remediated hosts within Service Providers to 5 remediated hosts for Credit Union.

We have provided an interactive plot allowing you to zoom in to dissect the various sectors.

There was a wide range in how quick certain sectors were to remediate the vulnerability, particularly when compared to the percentage of vulnerable instances that were remediated at all. Generally, most sectors were clustered around patching 30–45% of vulnerable instances in 150–200 days. No industry was perfect, and the highest remediation percentage seen was Healthcare/Wellness at 54%.

There were, however, numerous interesting outliers. Service Providers, encompassing cloud hosting and other partially-shared services, were by far the largest source of vulnerable hosts with 14,669 instances. However, only 22% of these have been remediated. Often who is responsible for these vulnerabilities (whether the provider or their customer) is ambiguous, so it’s not surprising they account for a large percentage of findings. While Bitsight has expansive capabilities in mapping assets hosted in the cloud to organizations, the shifting landscape makes it difficult to be comprehensive. Technology fared slightly better, however they still only remediated 26% and 29% of hosts, respectively.

While in general, sectors tended towards larger average times the more hosts they had to remediate, but there were still certain sectors that exhibited stronger performances than others. It is clear that certain sectors were better disposed to handle these vulnerabilities, likely corresponding to stronger patching programs and better organizational capabilities. Interestingly, these did not necessarily correspond to how seemingly technical the base industry was.

Remediation progress among recent vulnerabilities

Here, we will take a look at the remediation progress among recent vulnerabilities. We will examine each vulnerability with a particular focus on how the remediation methods were distributed over time as the total percentage of all remediations.

For example, for CVE-2021-26084, we can see that at the beginning of scan coverage, 100% of all remediations were achieved using workarounds. There was a strong push shortly afterwards to patch more and more systems, ending around December 6, 2023 once 24.5% of remediations were because of patching. Progress has remained fairly even since then, with a similar number of remediations achieved through both patching and workarounds.

Please note that these totals are inclusive of hosts that initially apply workarounds before later patching to the new software version. Additionally, hovering over a given point in time will allow you to see the exact totals for each method, which may not be self-evident if remediation increases for both are growing at the same rate.

recent vulnerability remediation progress

Global patterns in CVE remediation

In this section, we merged the data from all previously analyzed CVEs to extract global insights into vulnerability management practices. The patterns that emerge from this consolidated analysis closely mirror those observed in the Microsoft Exchange vulnerability, which isn't surprising given Exchange's ubiquitous presence across countries and industries.

The following visualizations help us understand how organizations worldwide approach vulnerability remediation, revealing distinct patterns across geographical regions.

This first graph shows the average vulnerability remediation times grouped by the geo-IP location country.

avg vulnerability remediation times by country

This next plot shows the same information grouped by the IP entity owner’s country of origin.

avg vulnerability remediation times by country entity

Comparing the two plots, we can see clear differences in many countries, including Pakistan, Sweden, and Ghana, to name a few. However, there is no clear pattern to the results, with each country faring differently on a case-by-case basis depending on organizational differences and local vulnerability awareness.

In the next graph, we examined how different sectors approach vulnerability remediation, comparing their average time to implement workarounds versus their time to apply full patches. The next visualization presents the average time organizations take to address vulnerabilities, examining workarounds versus patching timelines across different sectors, indicating a clear preference for implementing a workaround or patching, depending on the sector.

Conclusion

Our analysis of six major CVEs across different products and time periods reveals consistent patterns in organizational approaches to vulnerability remediation. The data shows that organizations typically favor rapid workarounds initially, followed by a gradual transition to complete patches.

The analysis exposes significant variations across different sectors, with technology-focused industries demonstrating faster response times compared to sectors like Finance and Aerospace/Defense. Older vulnerabilities showed a wider variance in remediation times compared to recent ones, suggesting that organizational responses become less predictable as vulnerabilities age. Most remediation activity occurs within the first 90 days of vulnerability disclosure, yet a concerning number of systems often remain vulnerable for over a year.

These findings underscore that effective vulnerability management isn't solely about technical capabilities but is deeply influenced by organizational factors, industry context, and operational constraints. This research also highlights why Bitsight's approach goes beyond simple version-checking when assessing vulnerability status. By acknowledging both patching and workarounds as valid security responses, we provide a more accurate and nuanced view of an organization's security posture, recognizing that workarounds often serve as temporary safeguards while organizations work toward implementing permanent fixes.

SOTU cover Image

Report: 7.7 Million endpoint logs for sale & more

Stealer malware is thriving—especially Lumma and Risepro. These logs fuel ransomware, MFA bypass, and persistent access. It's $10 to compromise an account. Explore this and other insights the data reveals.