Blog Explore expert perspectives, data-driven strategies, and the latest trends in cybersecurity, third-party risk management, and cyber threat intel — all from the leader in cyber risk intelligence. Filter by: TopicsArtificial IntelligenceOperational TechnologyBitsightBitsight ResearchCompliance & RegulationsCybersecurityCyber InsuranceCyber Threat IntelligenceExposure ManagementIndustriesReporting & AnalyticsRisk ManagementSecurity RatingsThird Party Risk ManagementVendor Risk ManagementVulnerabilities & Incidents - Author -Aanenson, Aaron (2)Akay, Arzu (4)Alcon, Joel (18)Allshouse, Austin (1)Almeida, Francisco (1)Anderson, Bill (1)Arnoud, Stanislas (3)Bagcilar, Sibel (24)Barnett, Jeff (2)Batista, João (6)Becker, Sandra (1)Bilodeau, Olivia (3)Borden, Seth (1)Boyer, Stephen (15)Bumpus, Hanan (1)Burton, Andrew (13)Cadet, Carlo (2)Camelo, Pedro (1)Campanelli, Alex (45)Campbell, Chris (2)Cardoso, Nuno (1)Casion, Dave (1)Cavanaugh, Sean (10)Chamberlain, Evongelene (1)Chen, Kevin (1)Cheong, Terence (4)Cherfas, Yaniv (1)Chickowski, Ericka (2)Cisternelli, Eric (15)Clancy, John (1)Cohen, Brian (1)Cruz, João (3)Dacri, Bryana (30)Dahlberg, Dan (11)David, Shir (3)Duffy, Michael (1)Edwards, Ben (14)Engineering, Bitsight (1)Fachetti, Dave (7)Fagan, Ben (22)Falé, Pedro (4)Falkowitz, Oren (3)Faria, João (3)Ferreira, Diogo (4)Ferreira, Francisco (3)Fischer, Elizabeth (1)Fonseca, Francisco (6)Freitas, Fábio (4)Gagalis, Nick (9)Gallagher, Caroline (1)Geil, Ethan (3)Gelnaw, Angela (21)Gerben, Chris (4)Gi7w0rm (1)Giaccai, Sarah (1)Gindes, Dana (1)Glórias, Paulo (1)Godinho, João (6)Gomes, Liliana (1)Goncharuk, Yevgen (1)Gosher, Dor (3)Graham, Kaitlyn (91)Grangeia, Luis (7)Grieveson, Tim (8)Grunewald, Julia (1)Habib, Cameron (1)Hadjinicolaou, Alex (1)Haroon, Maham (2)Hartzell, Matthew (1)Harvey, Steve (4)Heaslet, Abby (1)Heitsmith, Ryan (4)Hoffman, Michael (2)Holmes, Rachel (54)Hulme, George (10)Jackson, Tim (1)Jacobs, Jay (1)James, Jason (2)Jankowski, Vanessa (11)Johnson, Kim (18)Kaine, Sean (1)Kelly, John (1)Keshian, Greg (3)Klinchik, Chris (4)Kramarz, Paul (1)Lamoreaux, Jess (4)Leadership, Bitsight (1)Lei, Qionglu (4)Lerner, Dov (1)Light, Marc (1)Lopes, Nuno (1)Lourenço, Sofia (4)Luis, Sofia (8)Lux, Marco (1)Lyons, Joe (3)Majikes, John (1)Martins, Tiago (1)Matusek, Nicole (7)Mitchell, Carolyn (1)Montroy, Tom (3)Morss, Carla (2)Moyal, Oran (1)Mulligan, Brian (1)Neves, Catarina (1)Norremo, Anders (2)O'Brien, Ewen (2)Olcott, Jake (65)Oliveira, Raquel (2)O’Malley-Dertien, Kolby (1)Pacheco, Paulo (9)Pagnotta, Sabrina (77)Penkala, Ross (1)Pereira, Tiago (1)Pinto, Vasco (1)Platt, Dave (1)Potapov, Igor (1)Poulin, Chris (9)Puckett , Laura (2)Puentes, Patrick (1)Rashid, Abdullah (4)Ravanesi, Amanda (2)Reis, Miguel (2)Reish, Gabi (2)Rita, Ana (1)Roden, Kevin (1)Rosenbaum, Rich (1)Roxe, Jay (2)Salesky, Nicholas (2)Saltzman, Marc (1)Sandler, Ebin (1)Santos, Valter (1)Scharf, Ira (1)Schindlinger, Dottie (1)Shah, Samit (13)Shah, Sonali (9)Sideris, Luke (1)Silberstein, Ariela (4)Silva, Eduardo (1)Simon, Noah (30)Smith, Brandon (2)Soohoo, David (1)Stevens, Melissa (67)Stevens, Emma (57)Stone, Noah (27)Swimm, Ryan (1)Tamir, Matan (1)Tavares, André (9)Team, Bitsight (4)Team, Threat (1)Tegethoff, Evan (2)Thomas, Brian (88)TRACE, Bitsight (6)Tran, Viet (3)Turner, Tom (6)Umbach, Debbie (4)Umbelino, Pedro (19)Vadala, Derek (3)Vale, Mónica (5)Vaz, Bernardo (1)Venugopal, Shyam (1)Vijayan, Jai (1)West, Scott (2)Whalen, Nick (1)Wood, Scott (3)Woodward, Mike (2)Xiong, Yitao (1)Yang, Xiaofei (1)Yusupov, Naomi (3) April 07, 2026 Featured blog Building What Comes Next at Bitsight Read blog post March 31, 2026 Bitsight Research Ransomware with a Twizt: Inside the Phorpiex Botnet Read blog post March 31, 2026 Artificial Intelligence AI Integration Security: Why the Biggest Risk Is Not the Model Read blog post March 26, 2026 Security Ratings The 2026 Ratings Algorithm Update: Strengthening Accuracy and Stability Read blog post March 25, 2026 Vulnerabilities & Incidents Major Security Event: Supply Chain Compromise in LiteLLM Versions 1.82.7 and 1.82.8 Read blog post March 23, 2026 Third Party Risk Management The Hidden Third-Party Risks Behind Domain Hijacking Read blog post March 19, 2026 Bitsight From Risk to Resilience: A New Standard for Security Posture Management Read blog post March 17, 2026 Artificial Intelligence Are AI Security Tools the New EDR? Attackers Are Treating Them That Way Read blog post March 11, 2026 Bitsight Research RondoDox Botnet: From Zero to 174 Exploited Vulnerabilities Read blog post March 10, 2026 Industries Connected Vehicles, Accelerating Risk: Inside the Cyber Threats Facing Automotive Read blog post March 04, 2026 Third Party Risk Management Why Infostealers Are Central to Third-Party Breaches: A Look at the Top Malware Targeting Your Vendors Read blog post Pagination Current page 1 Page 2 Page 3 Page 4 Page 5 Page 6 Page 7 Page 8 Page 9 Next page
Blog Explore expert perspectives, data-driven strategies, and the latest trends in cybersecurity, third-party risk management, and cyber threat intel — all from the leader in cyber risk intelligence.
March 31, 2026 Artificial Intelligence AI Integration Security: Why the Biggest Risk Is Not the Model Read blog post
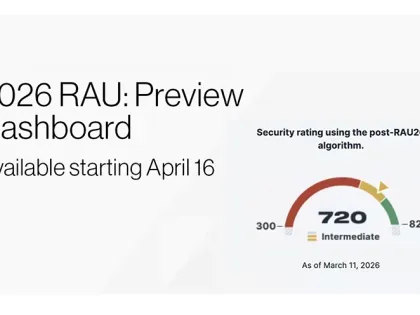
March 26, 2026 Security Ratings The 2026 Ratings Algorithm Update: Strengthening Accuracy and Stability Read blog post
March 25, 2026 Vulnerabilities & Incidents Major Security Event: Supply Chain Compromise in LiteLLM Versions 1.82.7 and 1.82.8 Read blog post
March 23, 2026 Third Party Risk Management The Hidden Third-Party Risks Behind Domain Hijacking Read blog post
March 19, 2026 Bitsight From Risk to Resilience: A New Standard for Security Posture Management Read blog post
March 17, 2026 Artificial Intelligence Are AI Security Tools the New EDR? Attackers Are Treating Them That Way Read blog post
March 11, 2026 Bitsight Research RondoDox Botnet: From Zero to 174 Exploited Vulnerabilities Read blog post
March 10, 2026 Industries Connected Vehicles, Accelerating Risk: Inside the Cyber Threats Facing Automotive Read blog post
March 04, 2026 Third Party Risk Management Why Infostealers Are Central to Third-Party Breaches: A Look at the Top Malware Targeting Your Vendors Read blog post