CVSS Is a Little Bit of Risk: Rethinking CVSS in Vulnerability Prioritization
Tags:


The best part about my job is that I sometimes get to make some controversial statements. Well, as controversial as things can be in a niche area of cybersecurity like “what is a reasonable measure of vulnerability risk?” Along with my colleague Sander Vinberg we got to explore this question earlier this year at the second Annual VulnCon conference in Raleigh. Even though it’s only been held twice, it is quickly becoming one of my favorite conferences. It brings together a significant number of important voices in industry and government to really talk about where we’ve been, where we are going, and what obstacles might be in our way in the realm of vulnerability management.
The observant reader can guess what exactly my controversial statement about vulnerability risk is from the title: CVSS is one measure of risk, though a noisy one. This statement contradicts the official documentation of CVSS-B Measures Severity not Risk, and there is no lack of articles defending this view point and being generally critical of CVSS. I won’t adjudicate all the arguments here, but I’ll try to summarize.
Risk is better defined as the “possibility of a loss,” i.e. there is some adverse event that may happen with some probability. With respect to vulnerabilities specifically, this would ask: “if I have a particular vulnerability at my organization, what is the possibility of loss due to someone exploiting it?”
To measure risk we need information about the two mentioned quantities: (1) the likelihood of the adverse event, and (2) the impact, monetary or otherwise. The assertion is that CVSS (we’ll use v3 in this article, though any version would be applicable1), whether in its vector form or as its aggregate score, does not directly measure either of these quantities (nor was it designed to)
The trouble with this way of thinking is that it assumes that a measure (a number or something ordinal) absolutely is or is not a measure of risk.2 Rarely is any measure of anything in security (or physical reality) perfect, and there are subjective opinions, errors, bias, and just random noise. The question we should ask when assessing any measure, and CVSS specifically, is not “is this risk?” but rather “how correlated with risk is CVSS?” In this post I’m going to show it’s “a little bit of risk” and, better yet, how we combine it with other popular measures to improve vulnerability prioritization.
A brief intro to CVSSv3 metrics
Before we dive into assessing exactly whether CVSS measures risk, it’s worth a few hundred words to talk about exactly what composes CVSS v3 to gain some intuition about why it is in fact correlated with risk.
CVSSv3 has four metric groups: two that fall into the “Base” portion (Exploitability and Impact), one in the somewhat oddly named “Temporal” portion, and one in the “Environment Section.” We are going to skip those last two because they are generally not scored by those doing the scoring, and they tend to be specific to an organization (Environment) or change over time (Temporal). Here are the eight we are considering.
- Exploitability Metrics
- Access Vector: What access does an attacker need?
- Physical(P): Gotta be at the keyboard.
- Local (L): On the same internal network as the vulnerable machine.
- Adjacent (A): On a network that is connected to the network of the vulnerable machine.
- Network (N): If it’s connected to the Internet, that’s all the attacker needs.
- Attack Complexity: How hard is this one to exploit?
- Low(L): Nothing special required, if the attackers got the code, he just has to run it.
- High (H): Maybe it doesn’t always “just work”, might require a race condition, or some other circumstances.
- Privileges Required: Does the attacker need the keys?
- None(N): Nope
- Required(R): Yep
- User Interaction: Does the user have to click something or download something or type something?
- None(N): Nope
- Required(R): Yep
- Scope: This one is a bit weird. It’s whether the vulnerability allows an attacker to move beyond the “security scope” of the vulnerable component. A canonical example would be a database vulnerability that allows an attacker access to the server it’s hosted on would result in Score:Changed. If the vulnerability just affects the database software itself (and the data within) it’s unchanged:
- Changed(C): Attackers can move beyond the security scope to other components.
- Unchanged (U): Attackers are stuck in the current scope.
- Access Vector: What access does an attacker need?
- Impact Metrics: The C/I/A Triad, ie, how borked is your data on the affected asset.
- Confidentiality: Attacker can access data they shouldn’t.
- Integrity: Attacker can destroy or alter data they shouldn’t be able to (though they may not be able to read the original).
- Availability: The attacker can deny access to the data, though maybe not alter or access it.
It doesn’t take much to imagine how the exploitability metrics might be correlated with the likelihood of a vulnerability being used in an attack. Network vulnerabilities mean attackers can operate at a distance, something more attractive than having to get local or physical access. Low access complexity with no interaction or privileges required means a higher likelihood of success when a vulnerable asset is found. Given this logic it would be unsurprising that vulnerabilities with particular CVSS would be more likely to have proof of concept code available or be used in ransomware attacks, both things directly implicated in the risk definition.
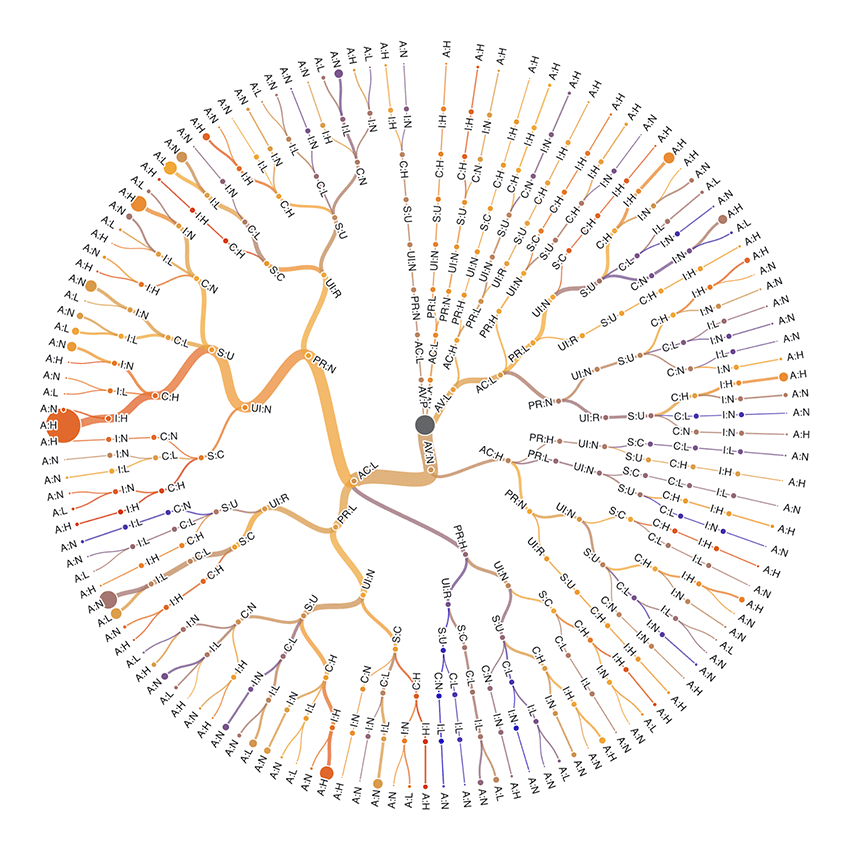
So far in 2025 there have been 40,547 MITRE published vulnerabilities, with 1,042 unique vectors. The top most common 150 of these vectors represent more than 90% of the vulnerabilities reported, so we’ll take a look at these in a complex visual (Figure 1). As an example we can move from the center (all vulns), straight down to Access Vector: Network (AV:N), proceeding to the left to Access Complexity: Low (AC:L), up and to the left to Privileges Required:None (PR:N), down and to the left to User Interaction:None (UI:N), back up to Scope:Unchanged (S:U), left to Confidentiality Impact:High (C:H), Integrity Impact: High (I:H), and Availability Impact:High (A:H), landing at the largest bubble indicating 3,468 vulns with that particular vector (score 9.8).
Can CVSS predict risk?
Rather than rely on a theoretical argument, let’s put it to the test shall we? First let’s ask, “given a CVSS vector is it possible to predict the existence of exploit code?” To check this we take a pretty simple Data Science 101 approach:
- Use CISA’s vulnrichment data that indicates PoC code as a 0 or 1 label.
- Use the CVSS vector as input.
- Using 5-fold cross validation fit a gradient boosted tree.
- See if we have any predictive power using a ROC curve.
Turns out the answer is: yes, a little! Check out Figure 2! For those not well versed in reading these charts this is a Receiver Operator Characteristic Curve (ROC Curve). It’s a way to display the performance of a binary classification model. Simply, the more the pretty colored line is “up and to the left” the better the classifier3.

Essentially, for whatever we pick as our classification threshold we can tune the accuracy or false positive rate and true positive rate. Here we have highlighted the point that gives us the best “F1 score,” but you could pick any threshold according to your risk appetite. Now, are we saying that this is actually some model you should actually use in vuln prioritization? Probably not, there are better models out there. Rather this demonstrates that the CVSS vector does correlate with risk and it's worth it to pay attention to those critical vulnerabilities from a risk perspective. In particular, if a CVE gets a CVSS score4, the score is often one of the earliest chunks of information available about a vulnerability.
Proof-of-Concept code is one thing, but what about actual exploitation? Using the same methodology, can we predict the use of a CVE in real world attacks, or further, whether those attacks were part of a ransomware campaign? There is no comprehensive set of data on this, but we can cobble one together from some publicly available ones:
- CISA KEV: Famous. These are vulnerabilities Federal Agencies are required to fix in a specific time frame because there is evidence of exploitation attempts.
- Bitsight Vulnerability Intelligence: The hot up and comer. Bitsight’s CTI capabilities are expanding and we have data on CVEs that APTs are actively exploiting and using in ransomware campaigns.
- VulnCheck KEV: Private but free. Launched in February of 2024, VulnCheck has been publishing their own KEV list of vulns they have evidence of exploitation of, but haven’t quite made the cut for CISA.
- Shadow Server: For the good of the Internet. The Shadow Server Foundation maintains a list of vulnerabilities that are publicly available.
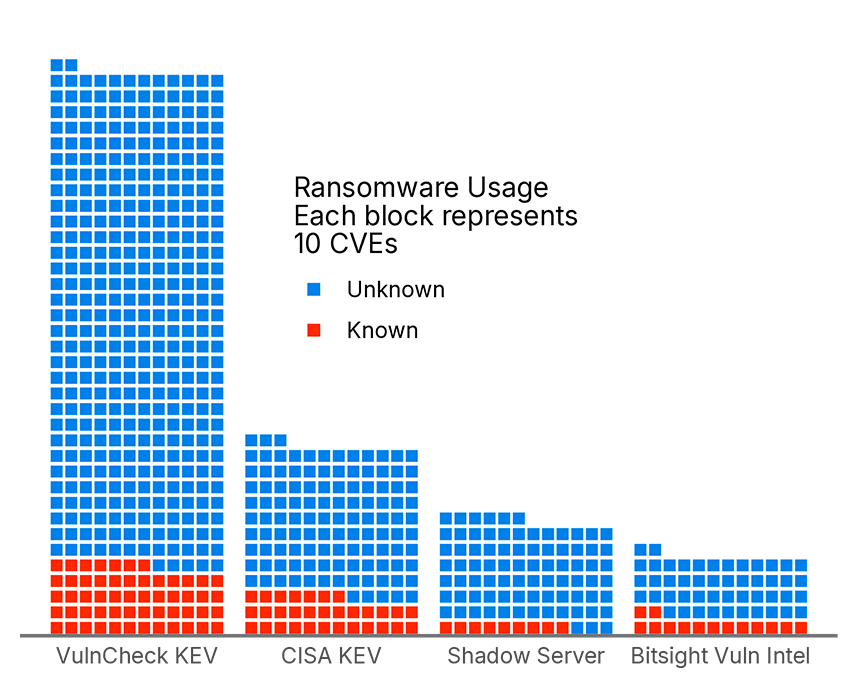
This data is shown below, with special attention paid to whether each data source denotes the CVE has known usage in ransomware.
So let’s apply the same method above (Gradient Boosted Tree) to try to use these data sources to predict whether a vulnerability is going to have ransomware based solely on the CVSSv3 metric values, and see if we can. Results in Figure 4 below.

A similar answer to proof of concept code, where this model would indeed do a not horrible job (a fair sight better than a coin flip) that a vulnerability is going to be used in a ransomware campaign in the future.
CVSS and Vulnerability Prioritization
Of course these basic models can’t hold a candle to models that take into account a great deal more data to more accurately predict vulnerability risk. I am of course referring to Bitsight’s Dynamic Vulnerability Exploit(DVE) Score and the open Explioit Prediction Scoring System (EPSS). Both of these systems strive to predict exploitation in the near future (DVE in the next 90 days, EPSS in the next 30), but cover different types of exploitation and use data collected from different sources. DVE strives to understand attackers using exploits based on data from the dark web, while EPSS uses vulnerability features and other data to predict the exploitation activity from a variety of network- or host-layer intrusion detection/prevention systems.
Like CVSS, both of these scoring systems are imperfect. A common complaint, despite their propensity for being right, is they will occasionally provide a low score for a vulnerability which is known to be exploited in the wild. This seems doubly galling when the vulnerability in question also has a CVSS score of 10.0. So this got me thinking: “Can we combine these measures in a methodologically principled way to come up with a useful prioritization strategy?4”
The answer is of course “yes”, as nearly every data challenge has been addressed in some way before. In particular, we draw on the idea of Consensus Ranking as a method of decision making where one tries to find an ordering of choices among various opinion havers that will make everyone the least upset. If we treat each of our scores (CVSS, DVE, EPSS, and some vuln intelligence on exploitation) as an opinion about the riskiness of a vulnerability, we can use a consensus ranking algorithm to come up with such a ranking of CVEs that is perhaps more likely to make folks happy. The result can be see in Figure 5 below.

What’s striking in Figure 5 is that we see a positive correlation for all measures, though weakest with CVSS and with some alluring multi-modal bands. Moreover, it shows some “blind spots” for each of the measures. High risk, known exploited vulnerabilities of various flavors (ransomware and apt) remain at the top of the consensus “worst”, but across some of these systems these would have disappointingly low scores. Moreover, there are some vulnerabilities that have rather high scores, but fall short on the consensus rank side, simply because other systems may not agree with the risk they pose.
Conclusion
What does this say about vulnerability risk? There are two lessons we’d like our intrepid reader to take away from this piece.
- An exhortation not to think about measures as “this is a measure of risk, while this other thing is not.” Rather we should think about how much measures like CVSS (or EPSS or DVE or whatever) can tell us about risk and to what degree.
- Do not be a measure zealot and do your best to see the whole field. All of these measures can give you new information about the vulnerability risk landscape, do not cling to any single one as the best, nor dismiss others because of their flaws.
For all our measurements, we are always dealing with noisy signals and collecting as much information about the particular context of a vuln is important. So when you hear about a CVSS Critical vulnerability, your ears should perk up and you should look into it if you know you have that particular software or device. Don’t take it as an absolute that you should panic, but rather as an indication that you should look into things further.
1 Even just “picking a version of CVSS” is not quite simple, as there are often multiple scores from different folks rating a CVE. We’ll take the highest base value we see for any given CVE.
2 It seems only Sith and security people deal in absolutes.
3 More complicatedly, the model outputs a value between 0 and 1 that a CVE has a Proof-of-Concept exploit. We can set a threshold (ɑ, shown as color) to say “everything below that value is not PoC everything above is” and ask how right we are. As we turn the value “up” (down and to the left from the upper right corner), we fail to correctly find CVEs that do have PoCs (True Positive rate goes down), but we also lower the False Positive rate.
4 And that is sometimes a big IF
5 And as a side benefit, I get to learn some weird methodology.
6 Since we’re predicting a value now we gotta tweak the xgboost algo a little but it’s essentially the same.