New! The Security Ratings report is now the Executive Report. Request your report to see enhanced analysis such as your rating, likelihood of ransomware incidents, and likelihood of data breach incidents.
BlueKeep Continues to Plague the World a Year After Emergence

Share:

Since its advent in May 2019, BlueKeep (CVE-2019-0708) has been observed to pose risks to information security worldwide. It is a vulnerability associated with a wide range of Microsoft operating systems that affords a bad actor leverage to remotely execute malicious code on affected devices. Remediation involves updating to the latest Microsoft security patches released to mitigate BlueKeep. Sectors that use Microsoft products extensively and persist in using outdated software are particularly susceptible to this threat.
In the wild, BlueKeep was observed to have provided a launchpad for virtual-currency-mining attacks. More specifically, BlueKeep is associated with the Remote Desktop Protocol (RDP), a Windows service that allows remote access to users’ desktop environments over the Internet. RDP itself has been a starting point for multiple ransomware attacks as recently in April and May 2020. Microsoft issued a number of statements alerting users to the prospect of more BlueKeep-based attacks and urging them to patch their vulnerable operating systems.
Bitsight started tracking BlueKeep in May 2019, and published this blog post in August 2019, providing an in-depth analysis of the initial findings. This post revisits BlueKeep a year after its emergence as a worldwide threat.
The Number of Affected Systems Has Dropped, but Only to About Half of Peak Levels
Bitsight is able to observe devices with vulnerabilities like BlueKeep using its proprietary Internet-scale scanner technology. Figure 1 illustrates year-long trends observed since the emergence of BlueKeep in May 2019. An increase of vulnerable observations followed the initial detections until July 2019, which was the height of the observation levels, followed by a gradual decline. It should be clarified that the increase in observations between May and July 2019 is not due to more systems being affected by BlueKeep. Rather, the increase signifies the scaling and maturation of Bitsight’s observational capabilities for BlueKeep deployed in rapid response to the emergence of the threat in May. A year after its emergence, i.e. in May 2020, BlueKeep vulnerability observations remained around 52% of the peak count observed in July 2019.
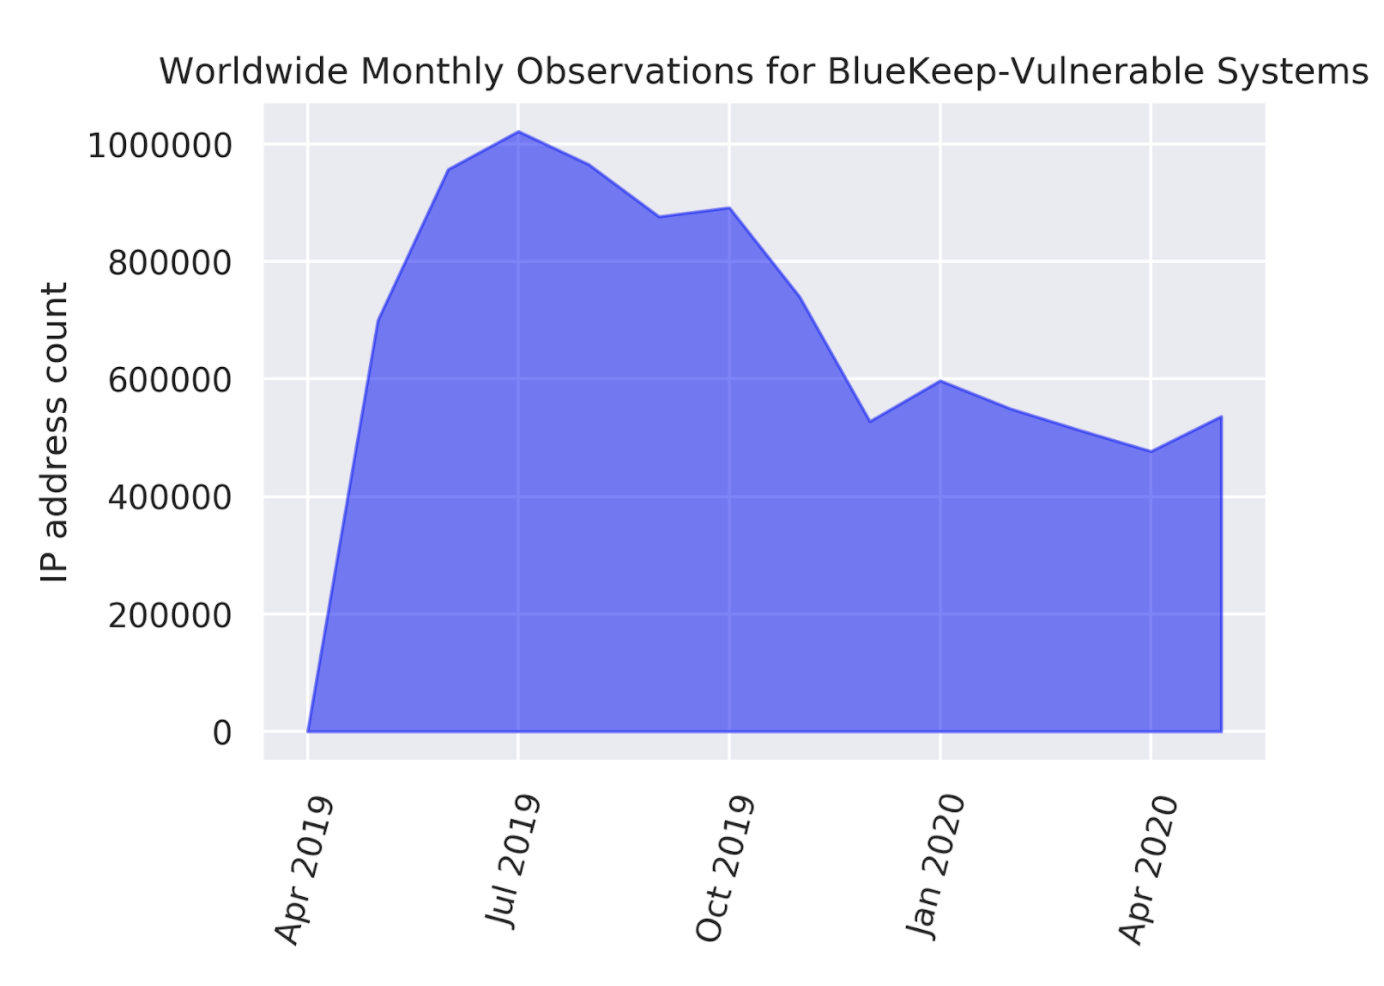
Figure 1 Monthly Observations of BlueKeep-Affected Internet Protocol (IP) Addresses Around the World.
Even after a year has elapsed, observations of BlueKeep-affected systems have dropped by only about half of their peak levels. Remediation efforts have only been about 48% effective.
While it is heartening to see that the vulnerability is on a decline, remediation efforts seem to have tapered off with only half the problem solved.
On Average, Roughly One-Third of Affected Entities May Not Have Resolved Their Vulnerable State After One Year
Considering sector-wise data from Table 1, entities affected by BlueKeep have failed to resolve their vulnerability in 19% to 52% of cases as of May 2020. The median rate of unresolved vulnerability at the entity-level per sector is approximately 36%, or approximately one-third. The best remediation performances are seen from the Legal, Insurance.and Healthcare/Wellness sector. The worst performance is seen from the Utilities sector, followed by the Technology sector at a close second. Government/Politics and Aerospace/Defense are notable sectors with performance nearing median values. The Telecommunications sector provides some insights into the behavior of private users. A few interesting trends are demonstrated by the Consumer Goods and Technology sectors, where remediation efforts seem to have affected sharp drops in the count of vulnerable systems, but failed to eliminate them completely. Subsequent sections provide more detailed reviews of these.
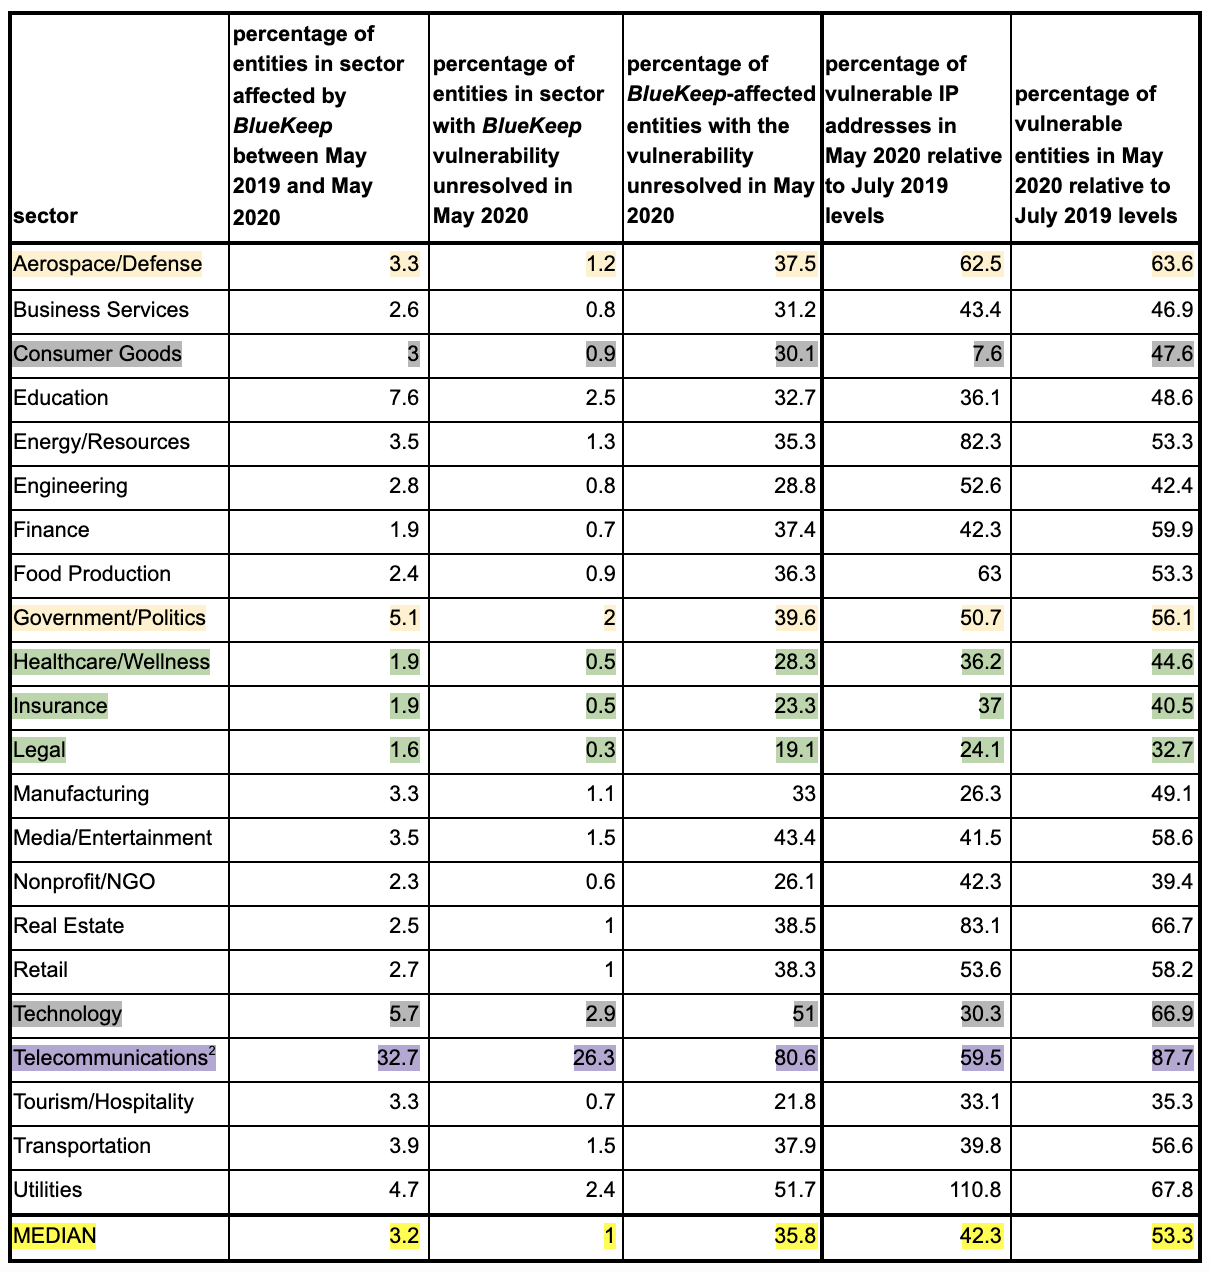
Table 1 Sector-Wise Details on BlueKeep Vulnerability and Remediation with Salient Details Highlighted.
Some sectors are high-performing in their remediation efforts, while others are mediocre when compared to median performance values. A few sectors adopt ineffective remediation efforts, reducing vulnerable systems significantly, but failing to purge themselves of BlueKeep entirely. Home-user data is a dominant component of Telecommunications sector observations. Details are available in the text.
Legal, Insurance, and Healthcare Sectors Take Effective Measures to Tackle BlueKeep
Around the first anniversary of BlueKeep in May 2020, only three sectors -- Legal, Insurance, and Healthcare/Wellness -- have less than 1% of their respective entities vulnerable to the issue. These sectors also have smaller retention rates of vulnerable systems (24-37%) compared to the median for all sectors (42%). Details are available in Table 1.
Given the recent COVID-19 pandemic, the Healthcare sector’s focus on mitigating the threat of BlueKeep is highly commendable. COVID-19 may have also increased claims volume for the Insurance sector as a result of various unforeseen losses to businesses worldwide.
Government and Defense Entities Have a Mediocre Showing
With elections in the United States scheduled in 2020 and various media reports on the likelihood of interference from foreign adversaries, cybersecurity performance of the Government/Politics sector is under close scrutiny. Another related sector is Aerospace/Defense.
Both sectors emerge as mediocre performers based on the data in Table 1. While 40% of Government/Politics entities affected by BlueKeep continue to be vulnerable in May 2020, the number for the Aerospace/Defense sector is around 38%. For comparison, the median is around 35%. In terms of proportion of vulnerable systems in May 2020 relative to the July 2019 peak, both sectors perform worse than the median of 42%. In May 2020, vulnerable IP address counts in the Government/Politics sector remain at 51% relative to July 2019, while this value is a whopping 62% for the Aerospace/Defense sector.
Some Entities in the Utilities Sector Fare Worse on BlueKeep Anniversary Than at the Height of the Issue
In Table 1, all sectors other than Utilities have lower rates of vulnerability in May 2020 than in July 2019 -- both for systems and entities. Although the number of affected entities in the Utilities sector is seen to have gone down over time, the number of affected systems is observed to have surged past the levels seen in July 2019. It is possible that one or more entities have failed to do their due diligence and deployed new BlueKeep-vulnerable systems around early 2020.
Trends seen in Figures 2.a shed more light on this. The number of vulnerable systems reached their initial peak for the Utilities sector in July 2019 followed by a decline. Oddly, near the beginning of 2020, a resurgence takes place, surpassing the July 2019 peak. Worse still, the vulnerable system counts seem to have stabilized at these higher levels. From Figure 2.b, it is apparent that the surge in vulnerable systems near the beginning of 2020 did not impact the count of vulnerable entities, which seems to have declined from a peak in June 2019 and equilibrated to a steady value around the beginning of 2020. 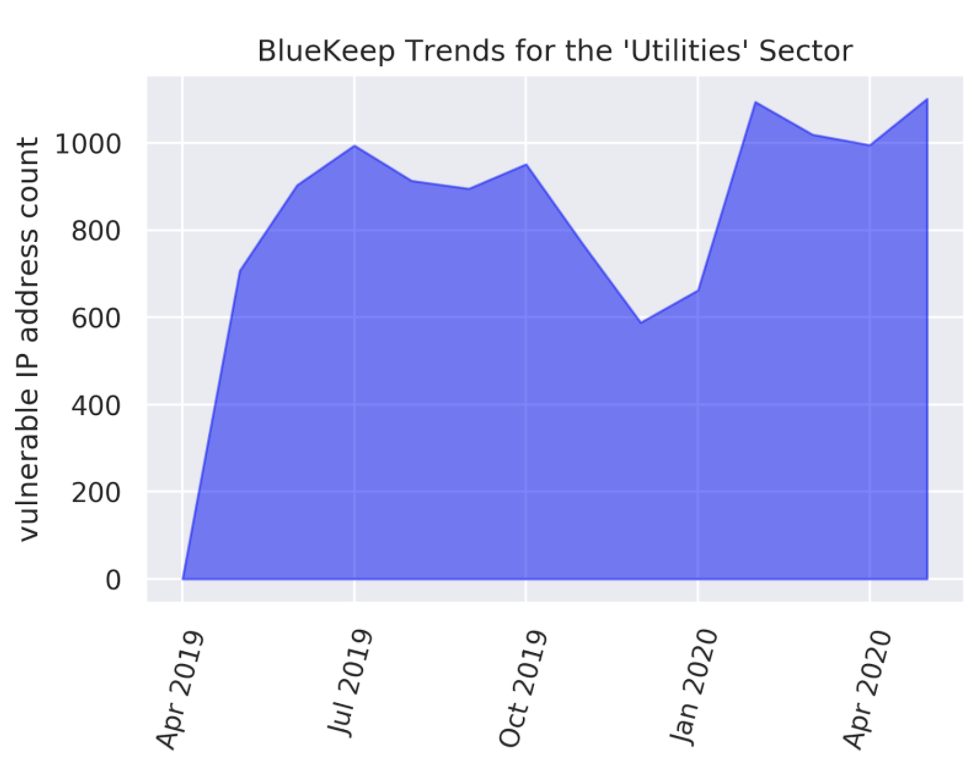
Figure 2.a Monthly Observations of BlueKeep-Affected Systems for the Utilities Sector.
The initial peak around July 2019 seems to have subsided, only to be revived near the beginning of 2020 and surging past the initial peak. Vulnerability levels seem to have remained heightened since.
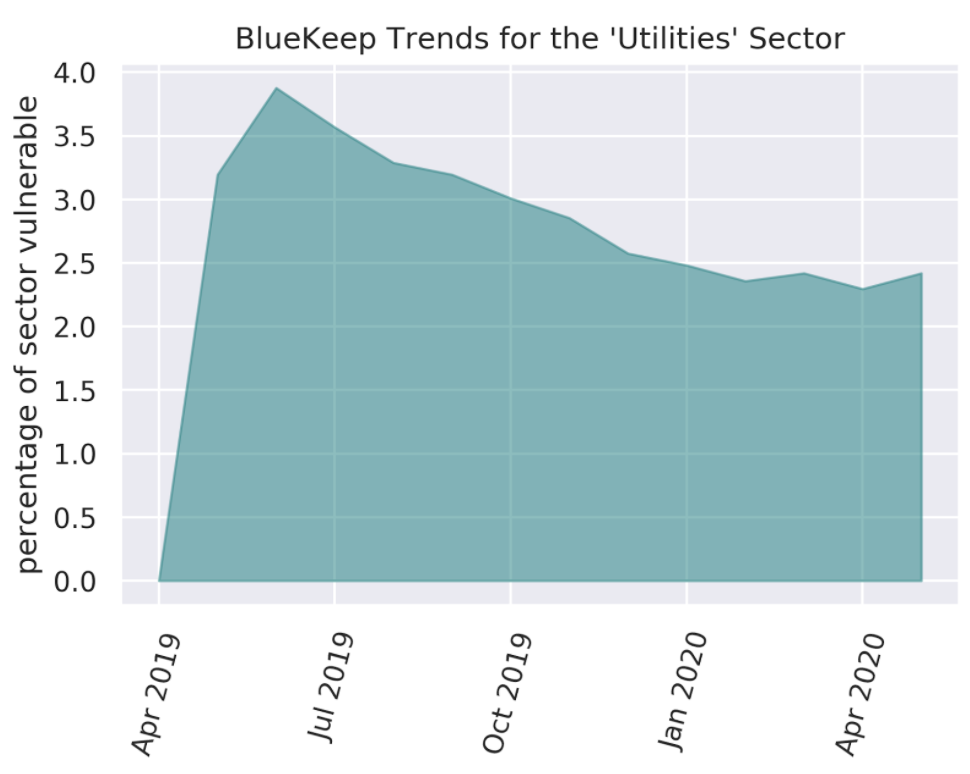 Figure 2.b Monthly Observations of BlueKeep-Affected Entities for the Utilities Sector.
The peak of vulnerable entities occurred around June 2019 and declined. Vulnerability rates seem to have stabilized in the few months leading up to the anniversary in May 2020.
Private-Use Consumer Devices Continue to be Vulnerable on Internet-Service-Provider Networks
The Telecommunications sector is an interesting outlier for Bitsight observations by virtue of the fact that it subsumes Internet Service Providers (ISPs). The network footprint for ISPs includes rich details on the behavior of end-users who subscribe to their Internet service.
How secure is your organization?
Considering trends for the percentage of entities affected in the sector by BlueKeep in Figure 3.a, a somewhat “flat” trend is cause for concern. It is highly likely that a sizable portion of private Internet users remain unaware of the threat posed by BlueKeep and continue their use of outdated Microsoft operating systems. In fact, as of May 2020, 81% of ISPs with initial detections of BlueKeep-vulnerable subscribers may be continuing to harbor these vulnerabilities. As for the trend of vulnerable systems count in Figure 3.b, the peak observation level from July 2019 seems slower in its decay when compared to Figure 1 for all worldwide observations. At the May 2020 mark, Telecommunications-sector vulnerability counts in Figure 3.b dropped to 60% of their peak levels, a smaller decline than the 52% of peak levels for the overall data in Figure 1.
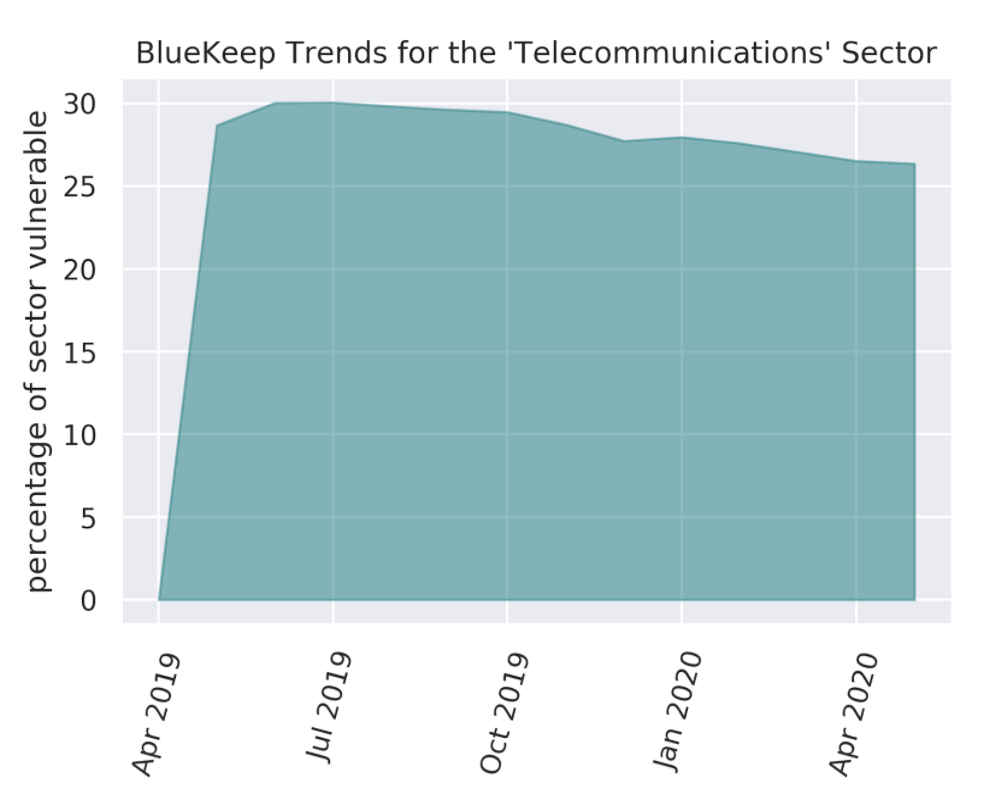
Figure 3.a Monthly Observations of BlueKeep-Affected Entities for the Telecommunications Sector.
Progress on BlueKeep-remediation seems slow. Most of these observations are possibly due to private subscribers on Internet Service Provider (ISP) networks.
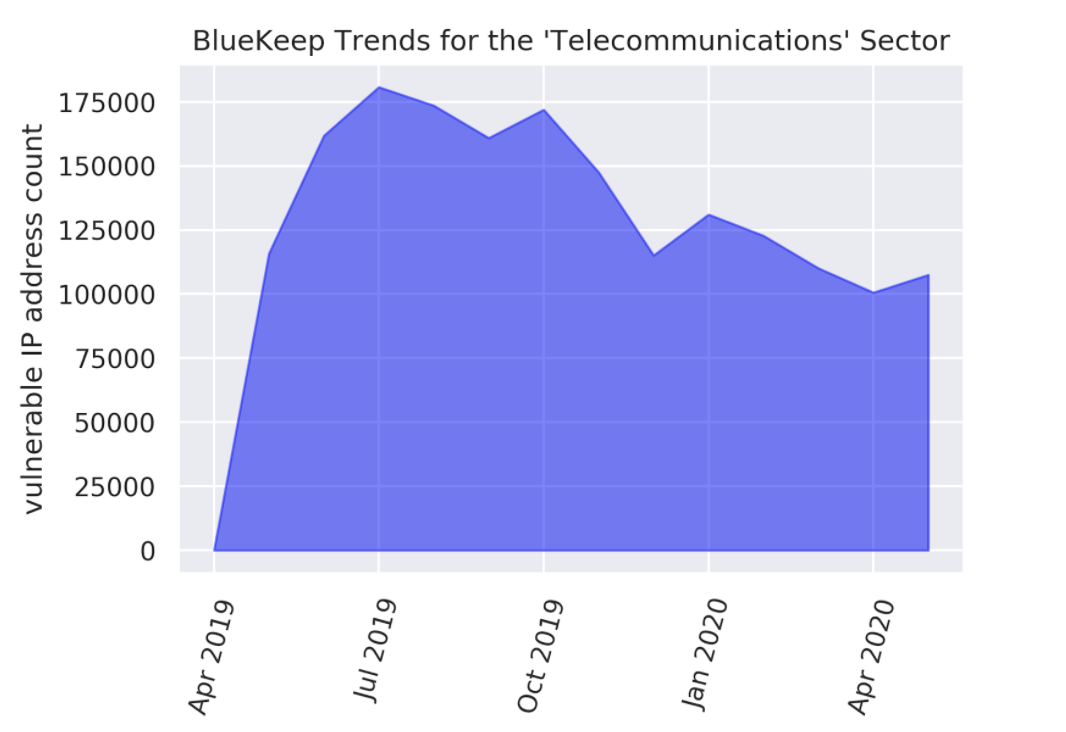
Figure 3.b Monthly Observations of BlueKeep-Affected Systems for the Telecommunications Sector.
The peak observed in July 2019 is falling at a slower rate than in Figure 1. In May 2020, vulnerability levels remain at about 60% of the peak (vs. 52% for Figure 1).
Consumer Goods and Technology Entities Reduce Vulnerable Systems Significantly but Fail to Eliminate BlueKeep
When considering trends for vulnerable system counts, the Consumer Goods and Technology sectors appear to be ideal adopters of remediation measures. Sharp declines in the count of vulnerable systems occur for the Consumer Goods sector in October 2019 and values continue to be low thereafter (cf. Figure 4.a). In May 2020, these counts constitute only about 8% of the counts in July 2019. The Technology sector follows a very similar storyline in Figure 4.b, with a significant decline in affected systems count near December 2019, followed by consistently low vulnerability levels, with only 30% of the July 2019 levels persisting into May 2020.
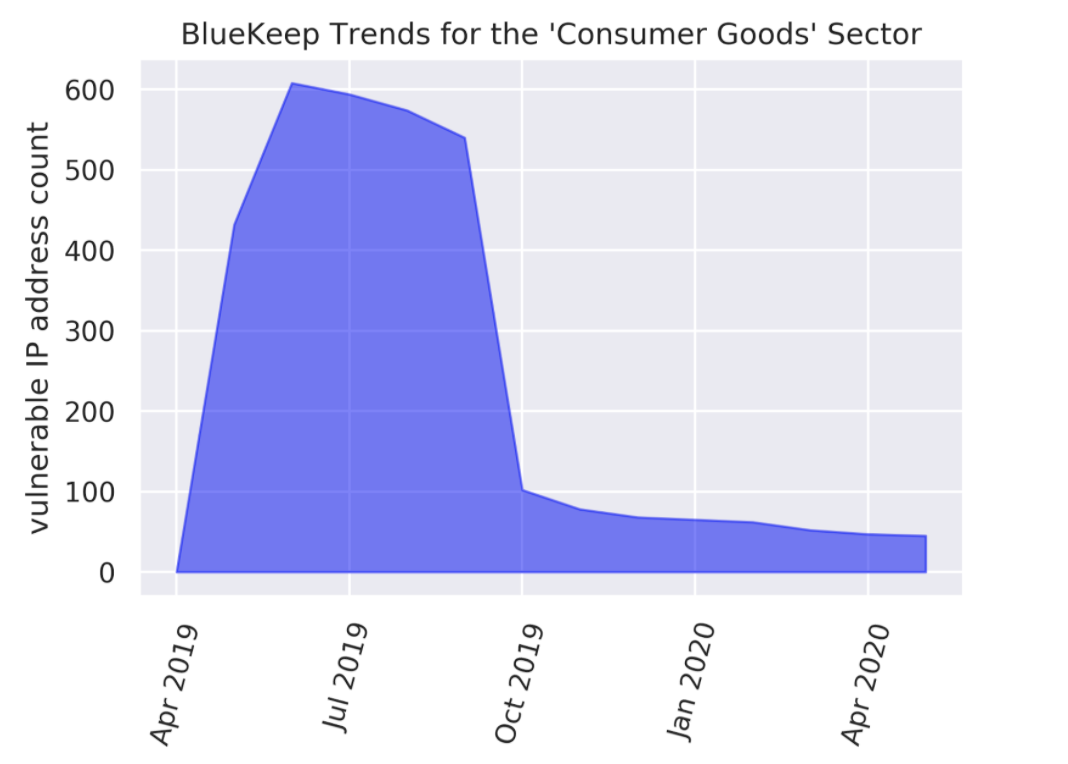
Figure 4.a Monthly Observations of BlueKeep-Affected Systems for the Consumer Goods Sector.
There is evidence of significant remediation activity around October 2019 that seems to have been effective in reducing the number of affected systems.
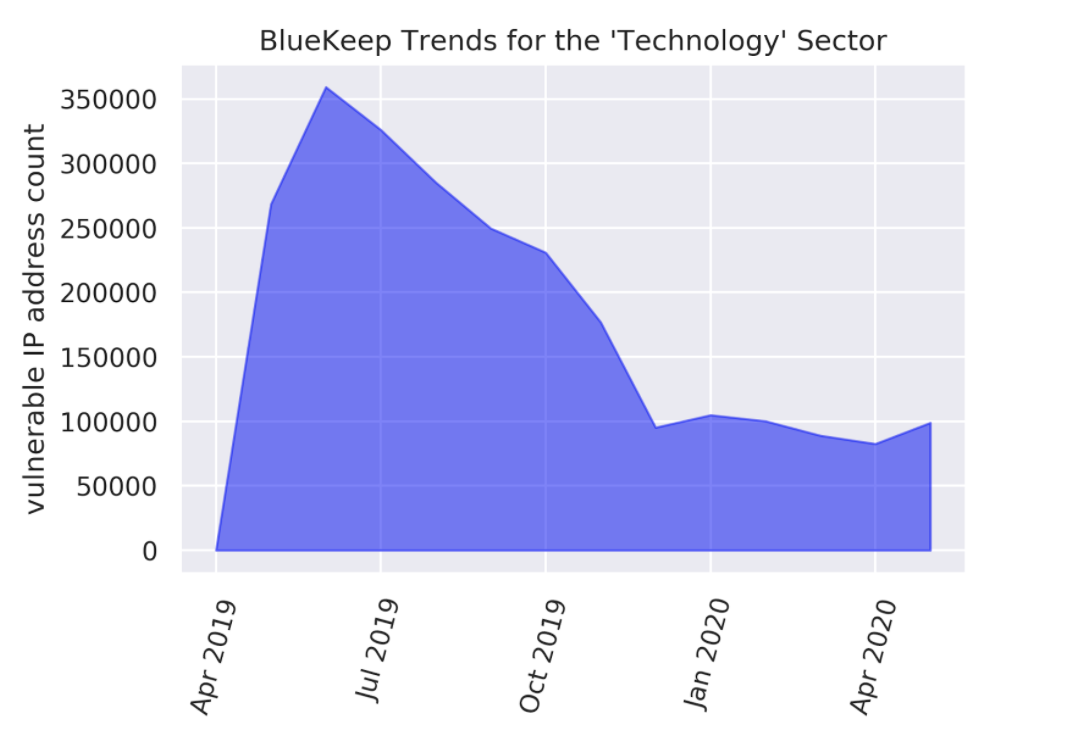
Figure 4.b Monthly Observations of BlueKeep-Affected Systems for the Technology Sector.
Remediation efforts around December 2019 appears to have been responsible for lowering the count of affected systems thereafter.
Unfortunately, success in the reduction of affected systems is not the whole story on remediations, as it did not translate into success in eliminating BlueKeep entirely from entities. For the Consumer Goods sector in May 2020, 30% of BlueKeep-affected entities still had one or more systems vulnerable. This value for the Technology sector was a shocking 51%, while the median value across all sectors was 36%. As seen from Figures 5.a and 5.b, the sharp drops in vulnerable systems in Figures 4.a and 4.b did not result in corresponding sharp drops in the number of vulnerable entities. Rather, the decline of vulnerable entities has been a gradual process. It is plausible that patching efforts in these sectors failed to address BlueKeep in a few systems, thereby having an effect analogous to a chemotherapy treatment that eliminates almost all cancerous growth but leaves a minuscule portion untreated and leaves the door open for future malignancy.
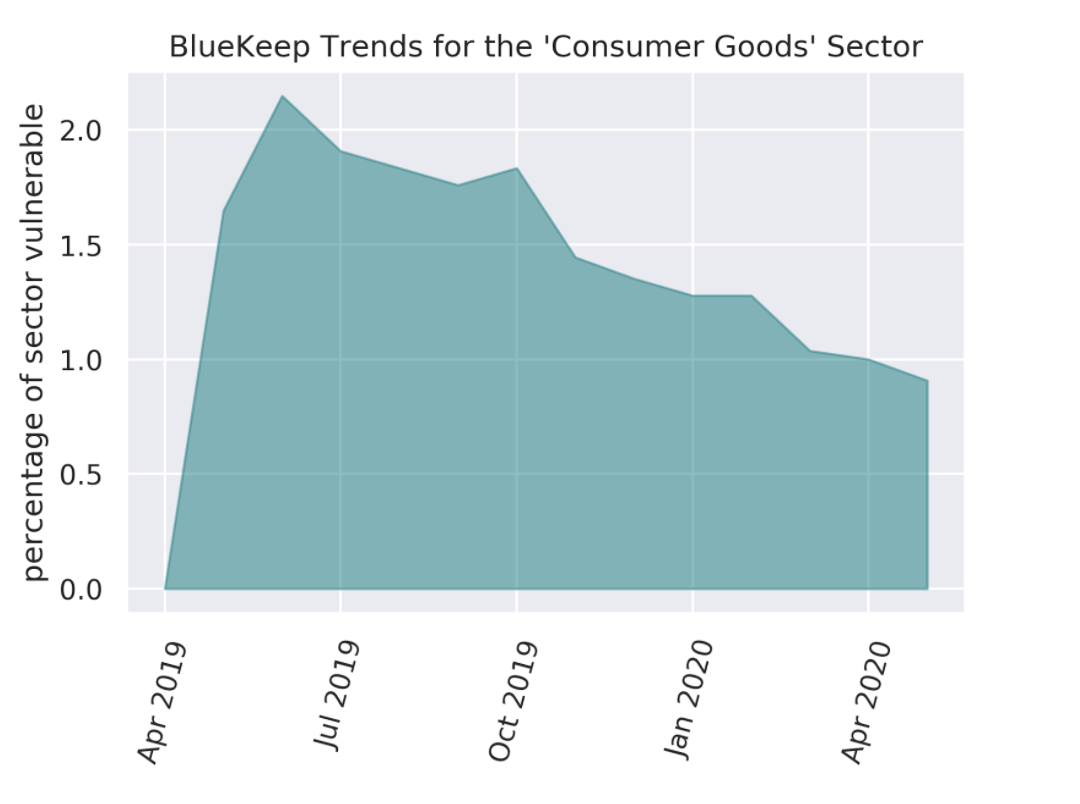
Figure 5.a Monthly Observations of BlueKeep-Affected Entities for the Consumer Goods Sector.
Remediation efforts from October 2019 (cf., Figure 4.a) seem to have had no direct impact on the count of BlueKeep-vulnerable entities. In fact, elimination of BlueKeep from entities seems like a rather slow process.
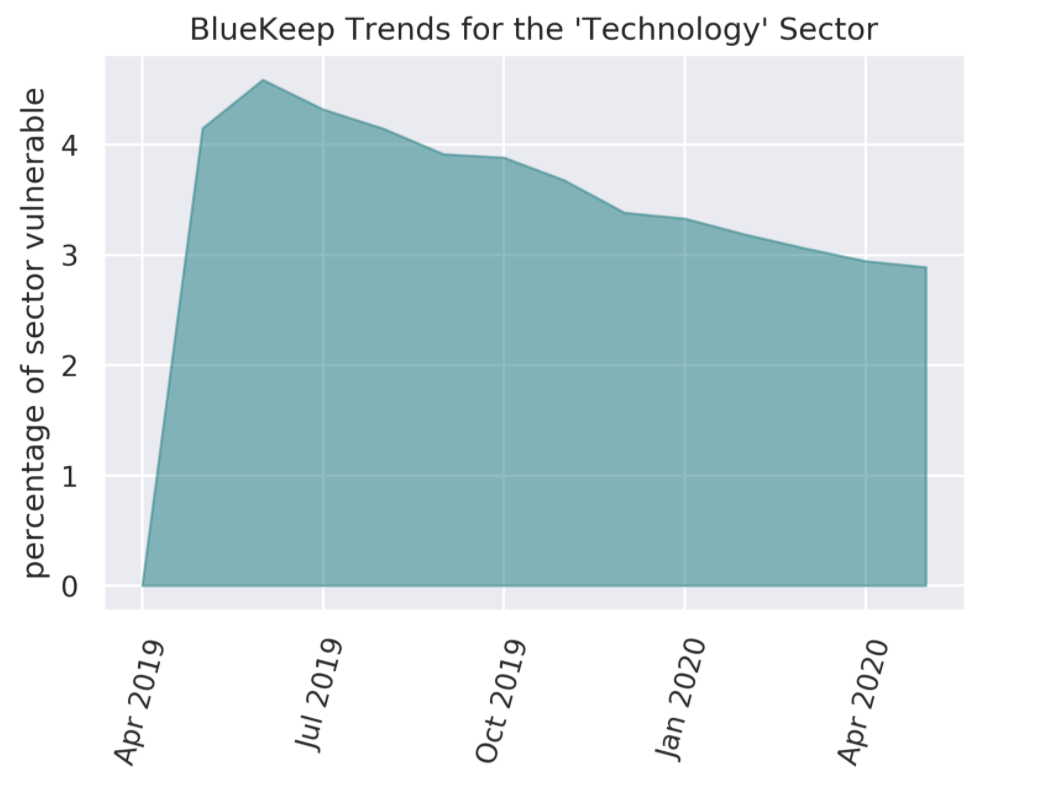
Figure 5.b Monthly Observations of BlueKeep-Affected Entities for the Technology Sector.
There is no perceptible impact of the December 2019 (cf., Figure 4.5) remediation activities on the count of BlueKeep-vulnerable entities. Entities seem to be purged of BlueKeep slowly over time.
The Industrialized World Leads the Mitigation of BlueKeep, but Only Gets the Job Half-Done
It would be instructive to compare the country-wide persistence rates of BlueKeep. To this end, levels of affected system observations in May 2020 can be compared to levels in July 2019, which coincides with the peak of BlueKeep proliferation (cf. Figure 1).
Figure 7 displays the top 30 countries by number of BlueKeep-vulnerable systems count in July 2019 alongside their May 2020 levels. China and the United States are seen to be leading nations, followed by a mixture of industrialized and emerging countries. All countries exhibit conspicuous drops in vulnerable systems count in May 2020 relative to July 2019.
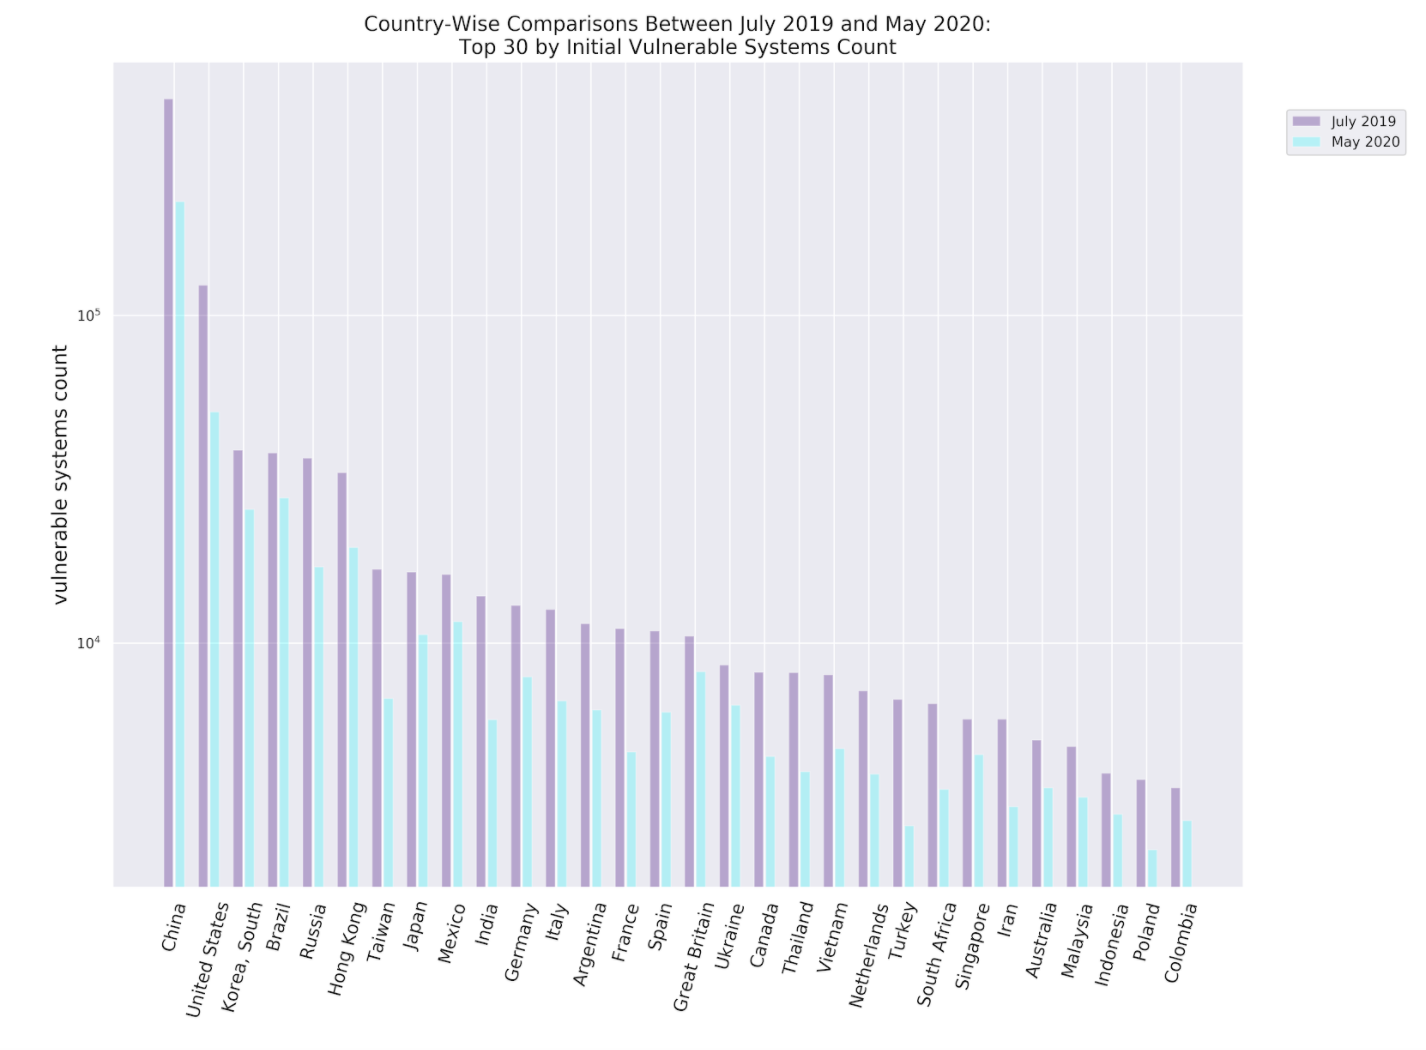
Figure 7 Top 30 Countries by Peak BlueKeep Counts in July 2019 with May 2020 Counts Included for Comparison.
China and the United States lead the counts in July 2019, followed by a mixture of industrialized and emerging nations.May 2020 levels are noticeably lower than July 2019 levels.
Persistence rates for the top 50 countries (with a minimum of 1400 observations in July 2019) in Figure 8 indicates that the industrialized world fared better at mitigating BlueKeep compared to the other nations of the world. This is somewhat unsurprising given a multitude of factors, such as better Internet access to facilitate the download of the latest software updates, more resources to allocate towards software upgrades and remediation programs, as well as lower overall rates of software piracy (and therefore, unrestricted access to official patches and updates). Interestingly, even the best-performing countries accomplished a lowering of vulnerable observations to only about half of the levels seen in July 2019. Hence, there is hardly scope for them to rest on their laurels. Perhaps, what is more of a concern is some countries seem to have made very little progress in rectifying the issue.
Furthermore, the position of the two largest economies -- namely, the United States and China -- in Figure 8 may be misleading in some ways While Figure 8 casts the two nations in a favorable light with respect to their BlueKeep-retention rates, they continue to be the worst performers in terms of vulnerable system counts (cf. Figure 7).
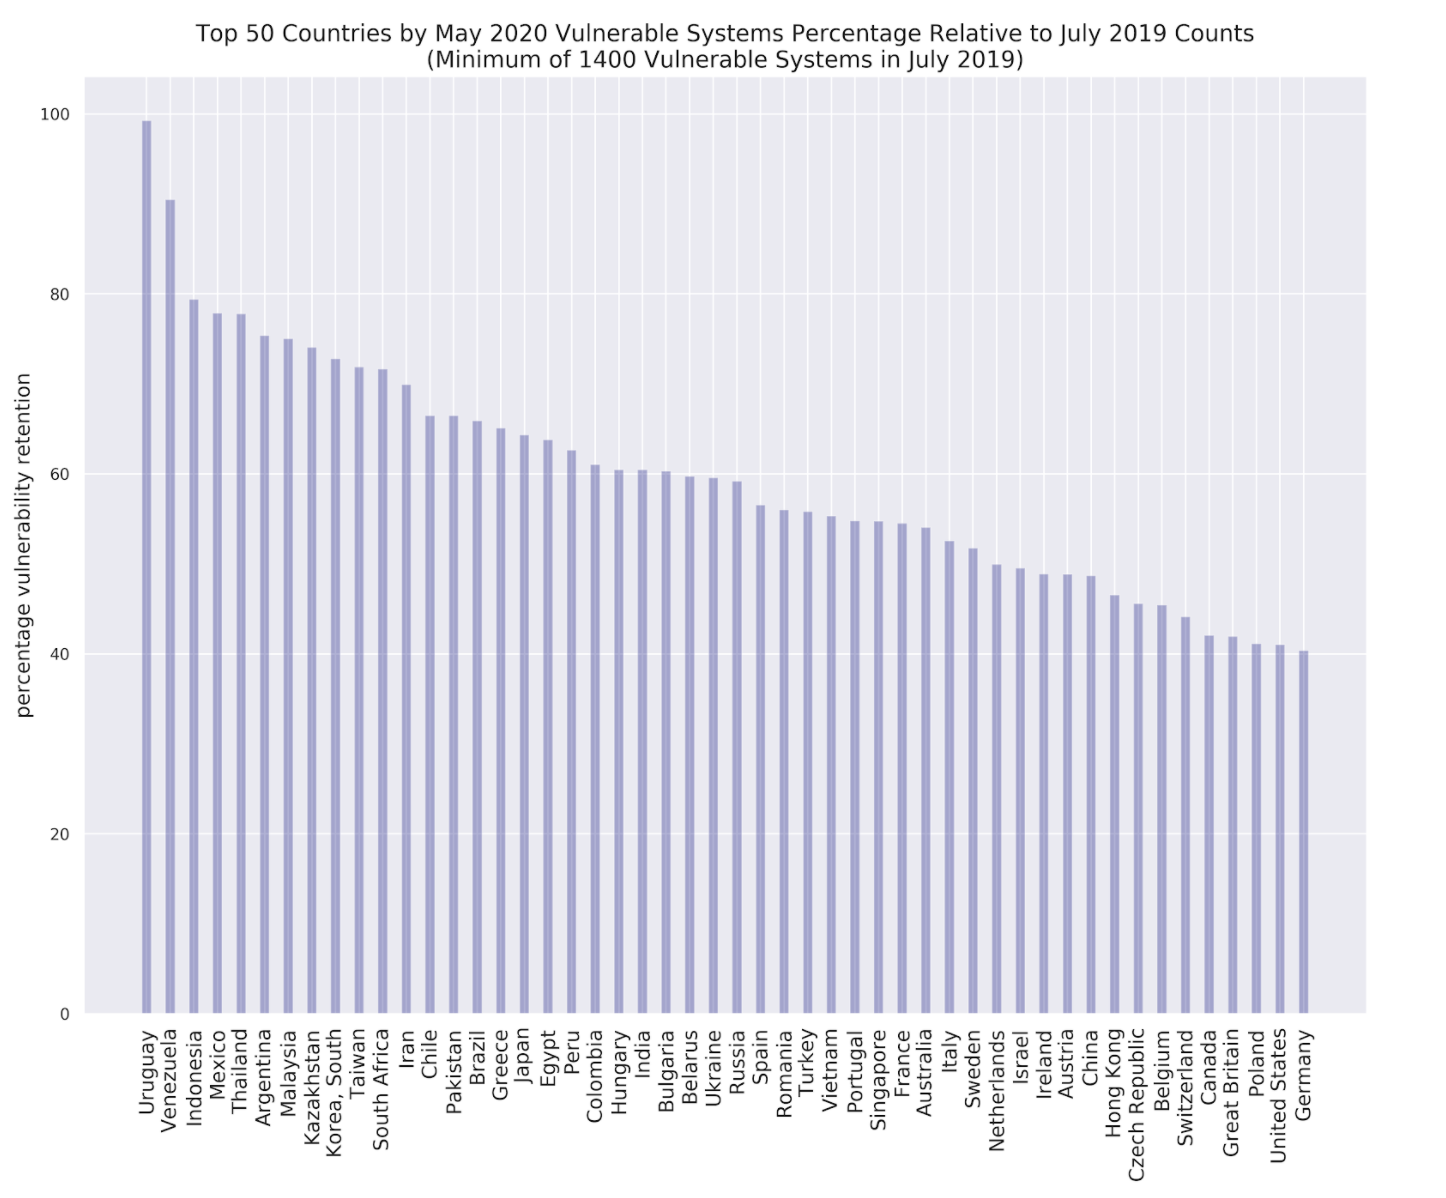
Figure 8 BlueKeep Retention Levels in May 2020 Relative to July 2019 for the Top 50 Countries (with 1400+ Vulnerable Observations in July 2019).
The industrialized world accomplished better results overall, but even the best only mitigated about 50% of vulnerabilities.
Conclusion: A Case for Keeping Software Up-to-Date
More than a year has passed since BlueKeep made news headlines. While the hype has died down and remediation efforts have taken a back seat, BlueKeep’s potential for harm has not yet been fully neutralized. The progress made through remediation efforts are encouraging, but they are not satisfactory. More importantly, there is hardly any room for complacency with such a high-severity issue. Systems administrators and end-users alike may wish to take note: Software updates may not be glamorous enough to make news headlines, but exploits based on outdated software certainly are!