Infection counters & measurement techniques

In June 2016, we observed an all time high of number of infections worldwide, breaking the previous record and raising the number of unique active observed IPs to 20,579,894 measured over a 7 day time window.
Although this number is impressive by itself, it pales in comparison to the vast volume of information that we process and analyse in total on a daily basis to ultimately provide accurate and detailed information to Cyberfeed subscribers.
As an example, today we were processed an average of 42,120 events per second across multiple sources, which yields about 3,639,168,000 daily events, or a staggering 101,896,704,000 total number of events on one single year.
But, back to the topic of infections, let’s deep dive onto the actual numbers.
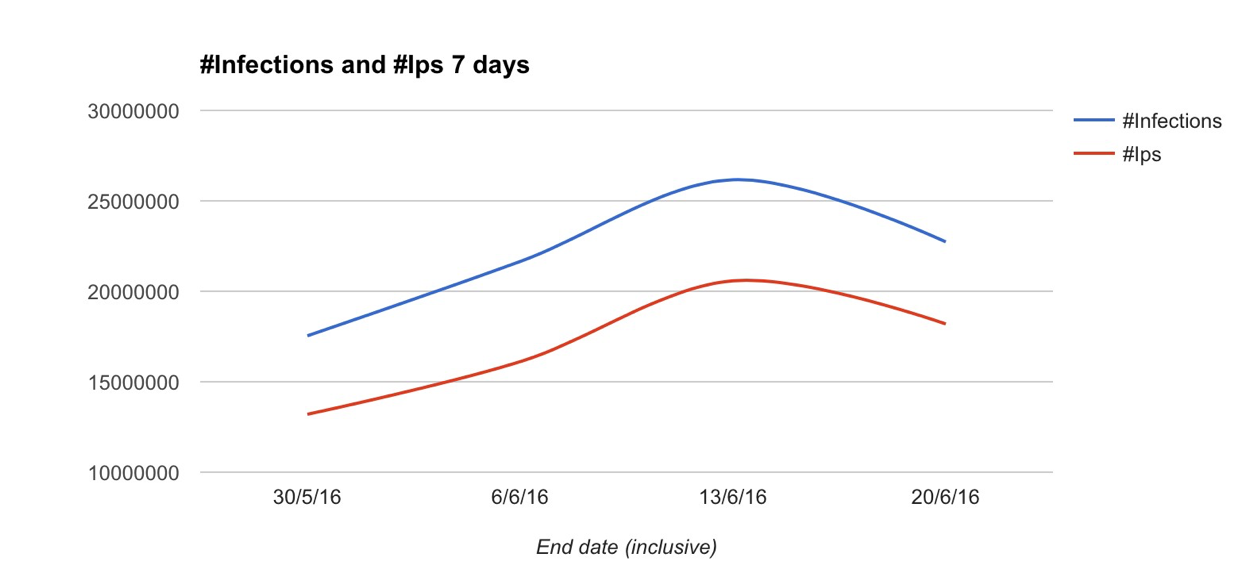
In order to understand the numbers above, it’s important to clarify what exactly we mean with “infections” in this context, and how this is measured.
The infections feed is one of several real-time data feeds we make available to our subscribers.This feed provides detailed information about C2 botnet check-ins and peer-to-peer communication between infected machines when controlled by a p2p botnet architecture (as opposed to a traditional C2 model).
We analyze the botnet traffic to clearly identify which malware family/variant is responsible for a given communication, as well as extract specific indicators and enrich the information with other data that we can relate to either the malware family or the infection origin.
In order to measure infections given the above methodologies for data collection, we assume two things:
- A sliding time window. This allows us to measure how many active infections we consider alive at any give time, by looking back in time and counting them up to the present day/hour/minute.
- Infection unique counter. For this, we assume that a combination of malware+IP address represents one infection. This is done because naturally one IP address not only can hide multiple devices, but each device can also be infected with more than one different malware family (read more about this below).
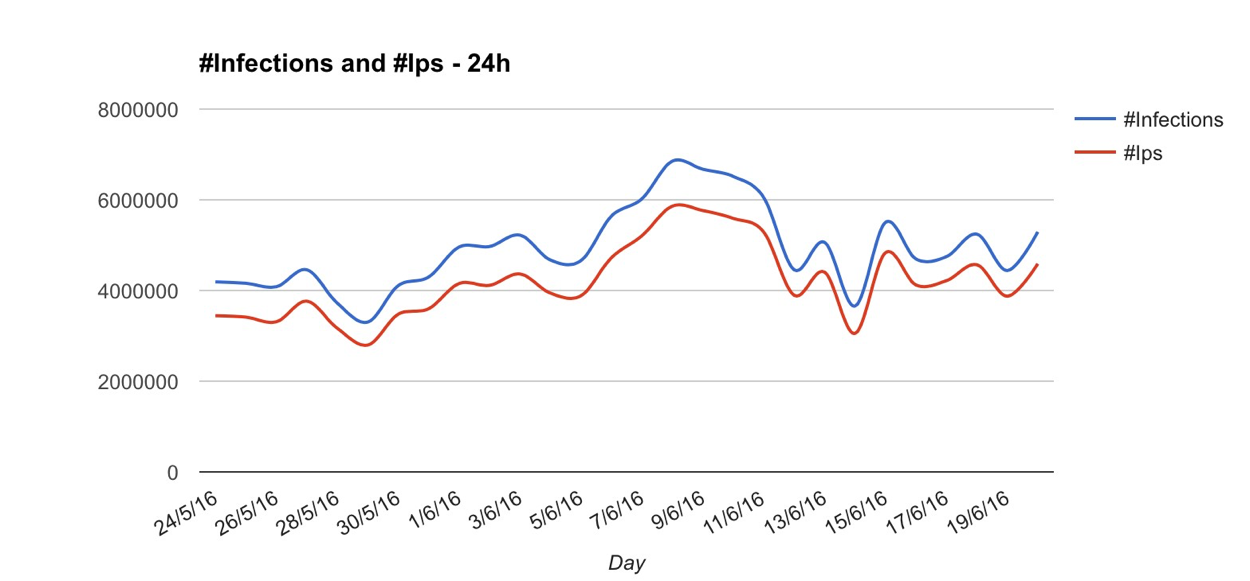
Obviously, changing how large the time window is, will yield different results. The below chart represents the exact same data, but measured over 24 hour slots, as opposed to the 7 day slots on the first chart (peaked at 6,851,202 unique infections).
Even though the numbers presented are correct given the methodology explained above, it’s important to mention that they rely on IPv4 addresses as the basis to calculate unique devices, and therefore their unique infections.
Unfortunately, the reality is that using IPv4 to measure this doesn’t actually represent the whole truth, as there are multiple factors that influence how devices present themselves to the Internet, and how Internet providers themselves assign and manage IP allocations to customers, such as:
- Organisation network gateways and proxies - A given organisation may have hundreds or thousands of devices on the network, but use a small group of IP addresses (or just one) for outbound connections. This means that when looking only at the pair IP address<>malware family, this network can have hundreds or thousands of infections, but it actually gets counted as only one infection.
- Aggressive DHCP rotation (https://en.wikipedia.org/wiki/Dynamic_Host_Configuration_Protocol ) - Some operators constantly issue new IP addresses to devices on a short time window. This is especially common on mobile networks, and the obvious effect is that a single device can change IP addresses multiple times within the same time window, potentially leading to a higher count of infections than the actual reality, depending on how large the time window is and the size of the network being used.
- NAT pools ( such as CGN - https://en.wikipedia.org/wiki/Carrier-grade_NAT)- Some operators, instead of issuing public IP addresses to devices, will use a private IP addresses and NAT them through a pool of public IP addresses. The result is that often on these networks a small group of IP addresses will in fact represent a large number of devices, which of course leads to much lower infections count than the actual reality.
Actually identifying unique devices, regardless from IP assignments, is a huge challenge, as different malware families communicate in different ways, and when using sinkholing or p2p botnet traffic to catalog and measure these infections, sometimes it’s not feasible to do this accurately, for all families and for all traffic.
When possible, we use a method that allows us to essentially “tag” a device, understand how often it changes IP address (or even locations), and profile the network attached to the device in regards to how it behaves with IP address assignment.
Actually looking at some examples of how this relation works on specific networks, gives interesting results, and is obviously something to consider when trying to understand how widespread a specific infection is, and how often the infection numbers are actually different from the reality.
# Network example A
Total unique infected devices: 274
Total IP addresses: 4
Observation period: 24 hours
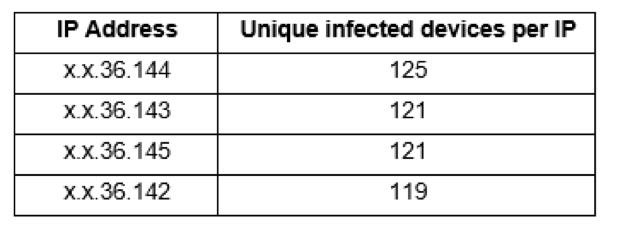
In this case we’re looking at 4 different IP addresses that are essentially being used as gateway by 274 different infected devices (measured over a 24 hour period of observation), therefore the actual number of infections is actually much higher than just the 4 that would typically count when using the traditional method.
# Network example B
Total unique infected devices: 176
Total IP addresses: 256
Observation period: 24 hours
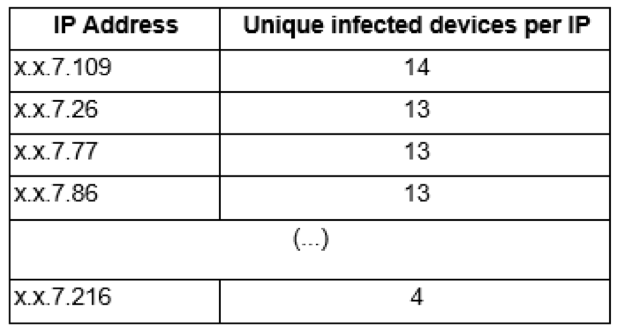
In this case we have a different scenario. 176 unique infected devices were observed frequently rotating between a pool of 256 different IP addresses, inflating a bit the actual number of infections.
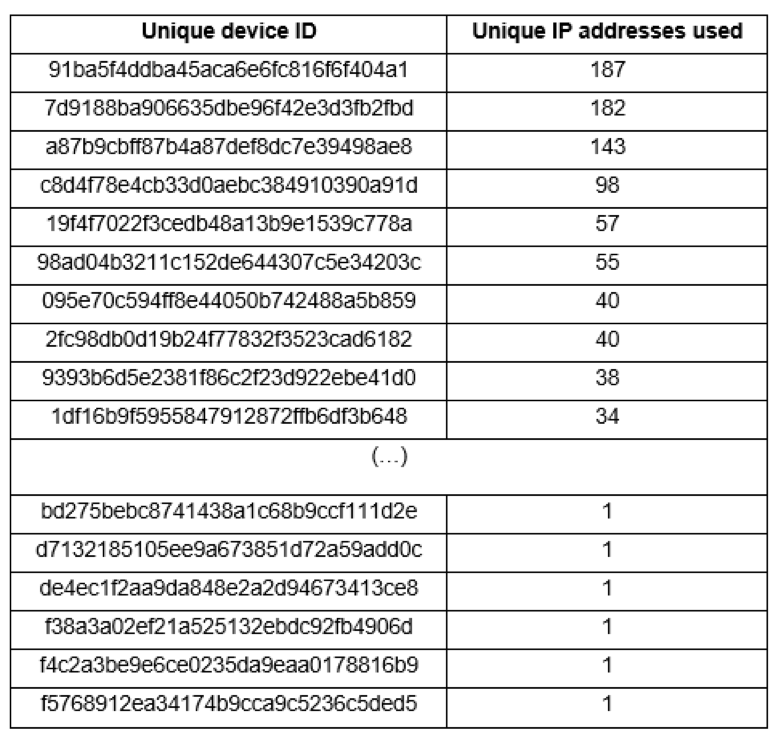
Even though each IP address relayed communications for anywhere between 4 to 14 different devices, if we look at how often each device changes public IP address, the numbers are also revealing:
Usually the reason why different IP addresses is related to how often a given malware checks in to the botnet C2.
If a malware family checks in every minute, this number will naturally be very different from those that connect every hour, or even a couple times per day.
Lessons to capture
Accurately measuring unique infections across multiple different networks worldwide is challenging, and the traditional methods that use unique IP addresses to do this, often lead to inaccurate results.
When evaluating different data feeds and looking at the numbers advertised by feed providers, it’s important to understand how exactly those measurements take place, as different providers will often show different numbers, depending on the methodology used.