Industry Response to the BlueKeep Vulnerability


It’s been five weeks since we first posted about the exposure of the BlueKeep vulnerability on the external networks of many organizations across the world. There have been further developments regarding the capabilities of the vulnerability including that both the DHS developed a working exploit and individuals from the private sector have also developed a remote code exploit. Both of these milestones further demonstrate the risk introduced by this vulnerability and the pressing statements by Microsoft and the NSA to patch.
Several weeks later, we want to understand if there has been any meaningful change in patching of externally exposed systems across all industries and how the response has manifested within individual organizations and countries. Organizations who are responsive at closing this new entry point on their attack surface introduced by this vulnerability will reduce the risk of future compromise.
Overview
As of July 2, 2019, approximately 805,665 systems remain online that are vulnerable to BlueKeep, representing a decrease of 17.18% (167,164 systems) compared to May 31. Part of that reduction is due to 92,082 systems which remain externally exposed that have been since been observed to be patched.
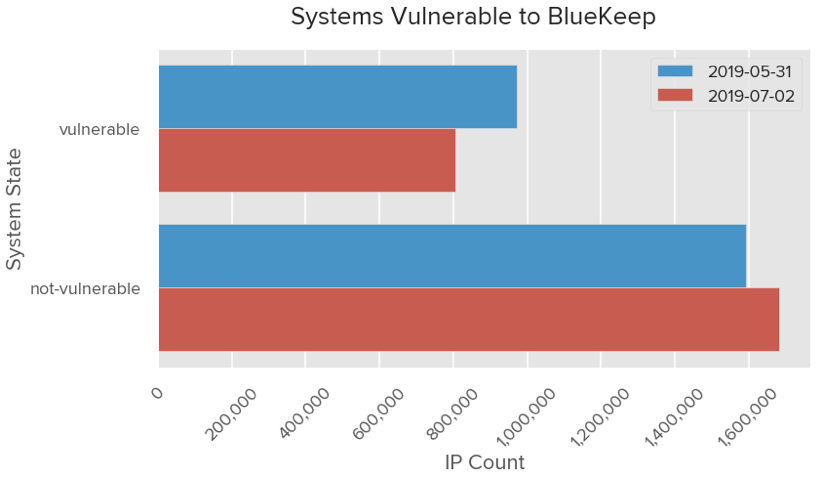
Assuming a simplistic average this represents an average decrease of 5,224 exposed vulnerable exposed systems per day. By consistently observing individual vulnerable systems that remain exposed to the Internet and then identifying when they’re patched, we can calculate that at minimum an average of 854 vulnerable systems per day are patched. The difference between these two estimates may represent systems which no longer expose the service to the Internet today, or those that are changing IP addresses frequently.
The absolute number of vulnerable systems will vary by time of day as these systems are powered off or powered on throughout the day or if the machines rotate IP addresses, which can cause the number to be overstated. We can reduce the noise introduced by these behaviors by understanding the companies associated to those systems.
Industry Exposure
The following chart shows the percent of companies within each industry that had vulnerable systems exposed externally on May 31 compared to July 2.
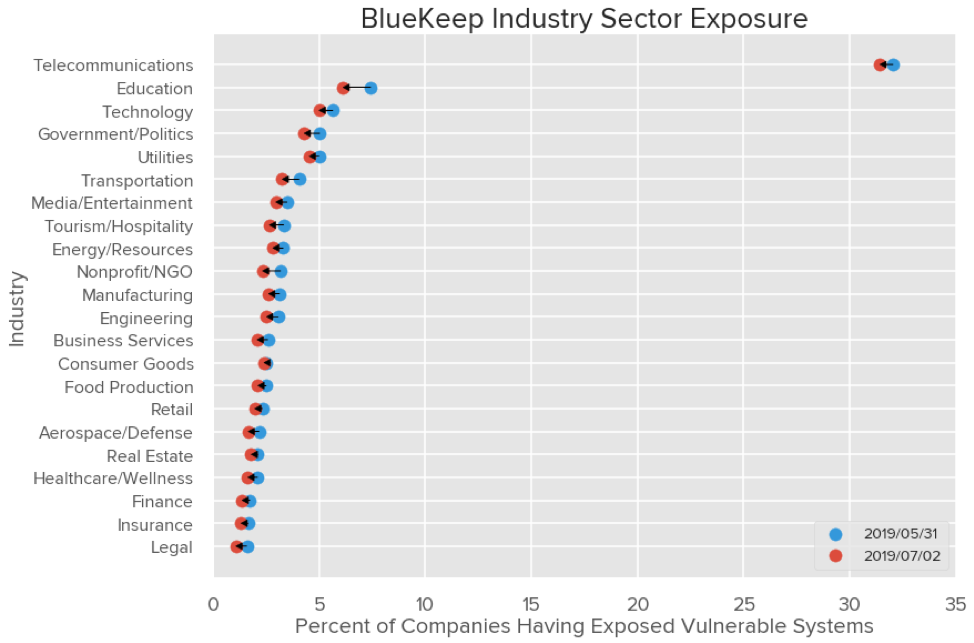 There has been progress made across the board as all industries have demonstrated a reduction in the number of organizations with exposed vulnerable systems since data collected on May 31, 2019, with variable amount of progress made within each industry.
The most responsive industries mitigating BlueKeep on their external network have been Legal, Nonprofit/NGO and Aerospace/Defense with a 32.9%, 27.1%, and 24.1% respective reduction in the number of organizations who were previously affected on May 31. Conversely, the Consumer Goods, Utilities, and Technology industries have been the least responsive, with only 5.3%, 9.5%, and 11.7% of organizations respectively affected having taken an action. We recently reported on the cyber security performance of the Utilities industry across additional areas.
With the mitigations observed, the Legal industry remains the least exposed followed by the Insurance and Finance industries. After Telecommunications and Education, the most exposed remain Technology, Utility, and Government/Politics. Telecommunications and Education often provide transit services and thus many of the issues affecting those industries are on systems of their customers. Residential networks are included as part of the Telecommunication industry while in Education, the largest group typically represents students.
The following chart shows the distribution Security Rating of organizations that took prompt action and remediated their all exposed systems compared to those organizations that still have vulnerable systems exposed.
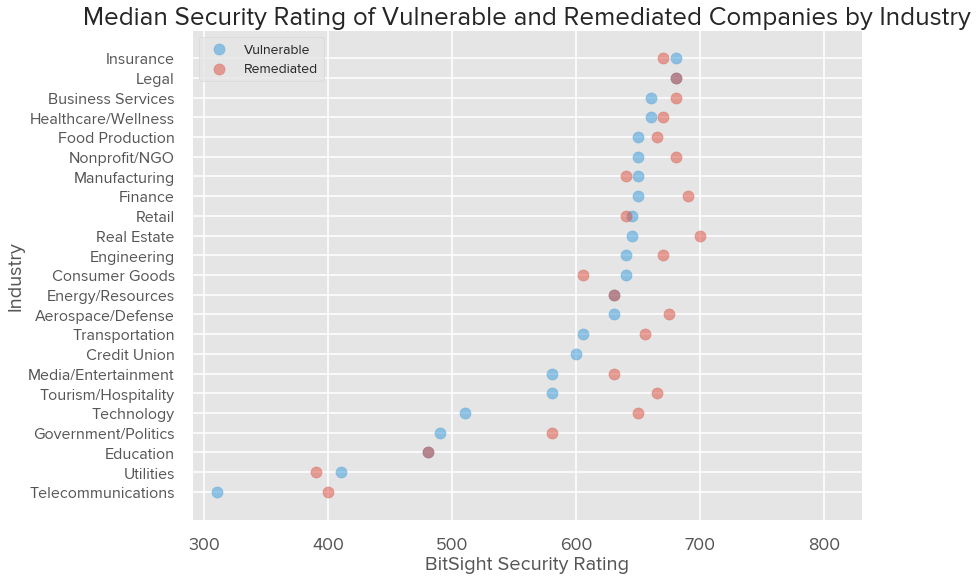 For nearly all industries, the collection of organizations that took quicker action at remediating BlueKeep have a higher median Bitsight Security Rating than those that still have systems exposed. Of organizations who have been affected by BlueKeep at some time, the Legal, Insurance, and Business Services industries have the highest median security rating while Education, Utilities, and Telecommunications have the lowest.
Geographic Exposure
Another way of understanding mitigation progress is assessing those systems by country. The following chart shows countries with the number of vulnerable systems exposed on May 31 on the x-axis, and the number of vulnerable systems exposed on July 2 on the y-axis. Note that the scatter plot below uses logarithmic scales, so the percent change for each country in absolute values is more notable than the chart makes it appear. The black line denotes a standard linear regression and points on the line would represent no change between these two observations.
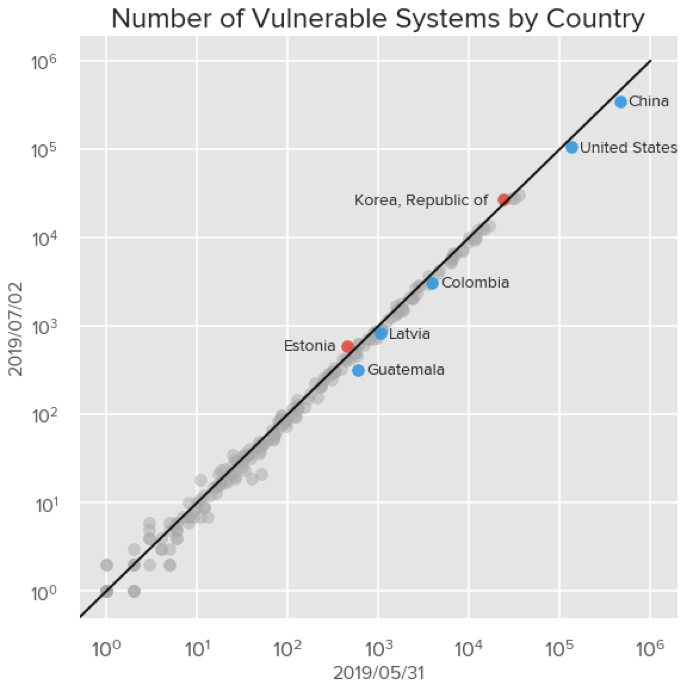
Ideally one would want to observe each country below the black line as that is showing a reduction of vulnerable systems in those countries. However, there remain countries that are relatively unchanged as well as countries whose number of exposed systems have increased.
More specifically, a number of countries demonstrated notable reductions in their attack surface. China showed the highest absolute improvement by reducing the number of exposed vulnerable systems by 109,670 which represents a 23.9% decrease. The United States followed suit by showing 26,787 fewer vulnerable systems exposed, representing a 20.3% decrease. Other countries showing a notable reduction in exposed systems were Colombia (21.3% decrease), Latvia (20.7% decrease), and Guatemala (45.4% decrease). However, there were a number of other countries that saw an increase in the number of exposed systems. Most notably were South Korea showing an increase of 3,430 vulnerable exposed systems, a 14.5% increase, and Estonia with 146, a 32.2% increase. Even after the recent progress, China and the United States still have the highest number exposed systems.
There are multiple ways a system administrator may mitigate against this issue affecting an externally exposed system. The primary and most important of which is actually applying the patch to the affected system. In addition, the administrator or user may remove exposure of that system to the Internet by taking it offline or applying proper access control lists to those systems to limit access to them. It’s been two months since the patch has been made available by Microsoft and we’ve only observed a 17.18% decrease in the number of exposed vulnerable systems in the last month. It’s important for organizations to patch their systems to not only protect their own data and systems, but those of their third parties that they conduct business with. Based on the current industry exposure, there remains progress to be made.
Discovering Affected Third Parties
Telemetry regarding BlueKeep is available in the Bitsight Platform, which allows customers to view and directly engage with affected organizations across their third-party ecosystem.
Customers may use the “Vulnerability” filter on the Portfolio page and select “CVE-2019-0708 (BlueKeep)” to understand the impact to a particular Folder, Tier, or the entirety of their Portfolio. Once selected, a user can dive further into the “Patching Cadence” section of the Security Report of a given company to view which systems are affected by the vulnerability. By Enabling Vendor Access, customers can provide third parties with access to the product and their respective forensics information to mitigate the issue.