Work from home-remote office networks are 7.5x more likely to have at least five distinct families of malware. Learn more about the hidden dangers lurking in residential networks.
Identifying Unique Risks of Work from Home Remote Office Networks

Share:

During the period of March 2020, we looked at a sample size of 41,000 US-based organizations to understand the difference between corporate networks and Work From Home-Remote Office (WFH-RO) networks from a cyber-risk perspective.
Some attributes of Work from Home - Remote Office Networks:
Malware:
- 3.5x more likely than corporate networks to have at least one family of malware
- 7.5x more likely to have at least five distinct families of malware
- Common families of malware are extremely prevalent including Mirai, which is observed 20x more frequently, and Trickbot which is observed 3.75x more frequently
Services & Remote Management Exposure:
- More than 25% of all devices have one or more services exposed on the internet
- Almost 1 in 7 WFH-RO IP addresses have exposed cable modem control interfaces
In this post we take a closer look at corporate associated residential IP addresses (work from home-remote office IPs) and discover attributes that pose unique cybersecurity risks as compared to in-office corporate networks. With companies around the world adapting to a remote workforce in an expedient manner, we wanted to understand any inherent and unconsidered risks posed to those organizations due to the home environment. We isolated the study to the assessment of the network perimeter of devices on those networks and researched the differences in the distribution of compromised systems observed on those networks on a sample of 41,000 US-based organizations.
In order to perform this study, we first had to programmatically construct the asset maps of work from home-remote office (WFH-RO) IP addresses associated with each company. Since Bitsight evaluates the externally-observable security performance of organizations across many industries around the world, we already had the corresponding maps of assets directly controlled and associated with organizations. We enriched the WFH-RO maps using the same aforementioned telemetry that we continuously gather to assess corporate cybersecurity hygiene as data points for this study.
Key findings include:
- As the number of employees and home IP addresses associated with an organization scales, the diversity of threats that their devices are exposed to on the local home network rapidly expands with it. During the period of March 2020, 13.3% of companies had at least one observation of a malware family on their corporate network for the families we observe, while 45.0% of companies had at least one observation of malware family on their WFH-RO networks, making them 3.5x more likely to have a malware infection present. 2.3% of companies had observations of at least 5 distinct families on their corporate network while 17.3% of companies had at least 5 distinct families observed on their WFH-RO networks.
- Residential networks exhibit their own unique attack surfaces with regards to network perimeter security. 25.2% of WFH-RO IP addresses have one or more services exposed on the Internet. Of those 25.2%:
- 61.2% of WFH-RO IP addresses that have one or more services open have an exposed cable modem control interface, either through the TR-069 / TR-064 protocols or other remote management functions, which have been an exploitation channel used by Internet-wide attacks in recent years. Against the wider population, this amounts to 15.3% of all corporate-associated residential IP addresses.
- At least 9.5% of WFH-RO IP addresses that have one or more services open have an exposed web administrative interface for their cable modems, routers, cameras, storage, and other IoT devices. Considering most of these interfaces are inadvertently accessible or infrequently updated by the user, they pose a significant risk in the days of IoT device exploitation through such channels. This amounts to at least 2.4% of all WFH-RO IP addresses.
- Corporate devices will be facing new risks of network compromise due to a higher population of malware that is more prevalent on residential networks. These malware families will pose a greater threat to devices whose operating environment relied on an over-emphasis on physical-based network controls. For example, Mirai is observed at least 20 times more frequently on WFH-RO networks than corporate networks, while Trickbot is observed at least 3.75 times more frequently on WFH-RO networks than corporate networks.
The move of corporate managed assets into largely unmanaged environments with its attendant increase in local threats brings challenges to security practitioners. Employee education may be the best approach to maintaining adequate security.
Work from Home-Remote Office IP Addresses
To perform this study, we had to discover the set of remote IP addresses used by the employees of each organization. To drive its Security Ratings product, Bitsight already has a set of high-quality, up-to-date maps of corporate network assets including those self-hosted and in the cloud. These maps are primarily constructed and maintained via automated processes with constant feedback from human intelligence to improve the automation. We used an extension of these processes to find additional IP addresses used by employees working at home or in remote offices by investigating the ecosystem of devices observed on corporate networks and finding their most closely associated non-corporate networks via session identifiers and device behaviors. Once that process is completed, we are left with a set of IP addresses for each organization representing a sample of associated residential networks that fit the criteria for this study. We term that set of IP addresses for each organization as their corresponding work from home-remote office (WFH-RO) asset map.
There are many sources of noise that complicate the discovery of associated residential networks, which if introduced into the resulting asset maps, can cause significant skews in findings and results. These sources can include IP addresses used by cellular networks, carrier-grade Network Address Translation (NATs) serving many consumer networks, or common access points such as Internet cafes or transient access services such as hotels and airports. One input of how we measure risk for our Security Ratings is to assess the distribution of Internet-facing workstation and mobile operating systems in-use at organizations. We not only look at the mere presence of the operating system of Internet-facing assets (e.g., the use of Windows XP) but we also model the number of systems using that operating system (i.e., the presence of an estimated 1,000 Windows XP machines is more notable from a risk perspective than an estimation of a single Windows XP machine). The more prevalent an out-of-date operating system is within an organization, as well the number of distinct out-of-date versions, is a telling insight into the security controls and practices at a company. We used the foundation of these principles and models into order to significantly improve the quality of the WFH-RO network asset maps.
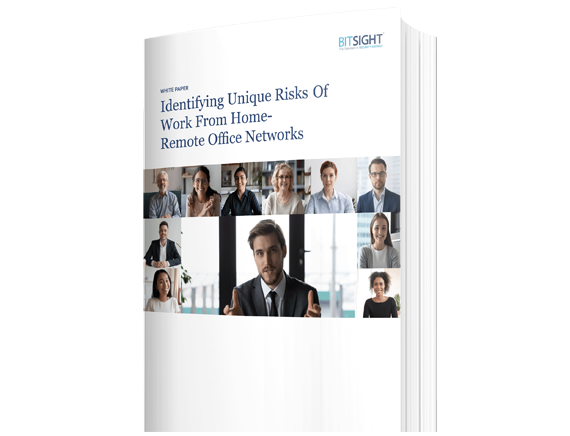
The following graph is a visual representation of how the individual WFH-RO IP addresses are connected with the corporate network after the noise-reduction process has completed. The IP addresses directly managed by the company are highlighted in blue while the black nodes represent WFH-RO IP addresses associated with that organization. The lines in between the nodes represent the relationships identified between those IP addresses.
Depending on the organization, IP addresses can be seen to be clustered by geographic location of the physical office locations.
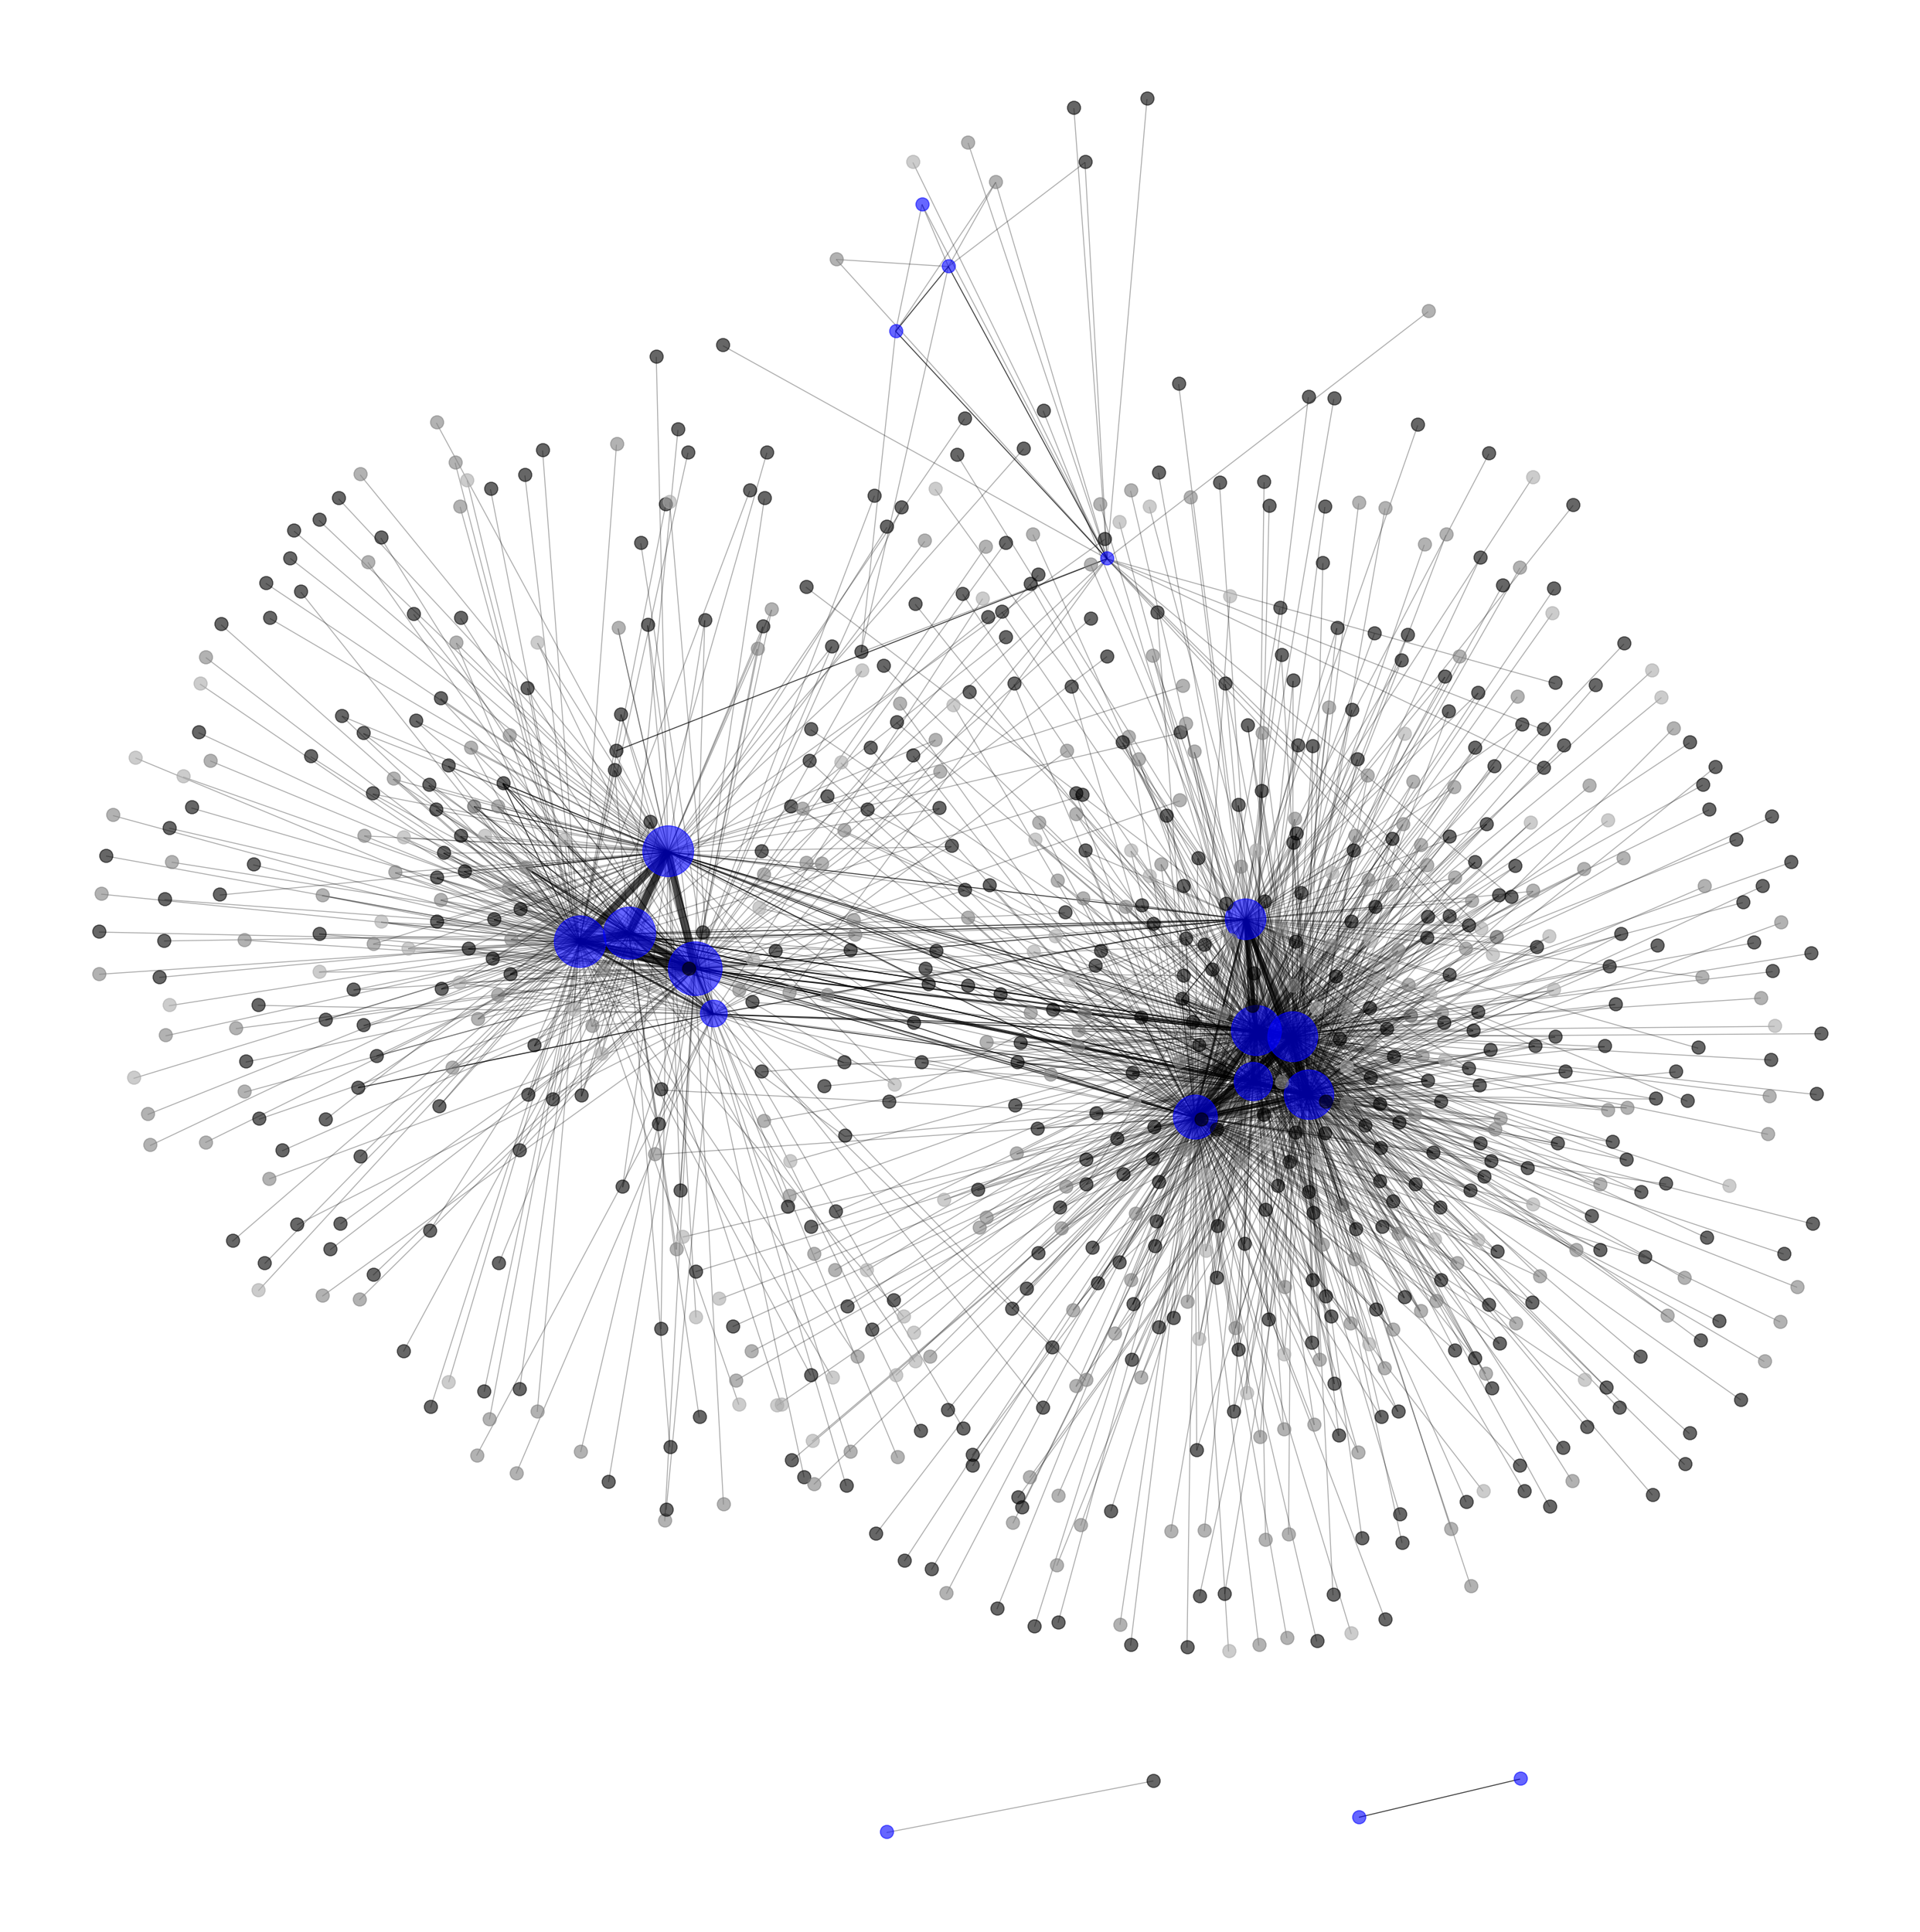
Other more centralized corporate networks, or those without a large physical footprint, resemble more straightforward spoke-hub graph representations, as shown in a larger organization, below.
Network Perimeter
The network perimeter and subsequent access control layers are one of the most closely managed and watched elements of a comprehensive security and network operations program. The first artifact we wanted to understand was how the perimeter attack surface differed between work from home-remote office networks and their corresponding corporate offices.
When we assess the perimeter of these corporate-associated residential IP addresses, we find that 25.2% of them have one or more services exposed on the Internet. The following bar chart shows the distribution of ports and services across IP addresses belonging to corporate networks and IP addresses belonging to WFH-RO networks. The port and service counts are normalized by the total number of IP / service pairs for each category in order to highlight the differences in the distributions between the two types.
-4.png)
From this chart, there are a few notable observations:
- As one would expect, corporate networks have a significantly higher relative number of systems self-hosting email-related services, such as SMTP, POP3, IMAP and its TLS-protected equivalents. These services are close to non-existent on WFH-RO networks. In fact, some consumer Internet Service Providers block or simply inhibit residential networks, including some of their small business customers, from self-hosting email in order to reduce the probability of spam originating from their networks.
- Other services, such as the web service for cPanel, Web Host Manager (WHM), and WebMail administrative interfaces commonly observed on ports 2082 & 2083, 2086 & 2087, and 2095 & 2096 respectively are also almost exclusively observed on company networks.
- Likewise, other protocols, such as those associated with SSH and databases have a very minor presence on WFH-RO networks but are more extensively observed on corporate networks.
Another way of looking at this distribution is to show the most relative prevalent services exposed on WFH-RO networks in comparison to company networks:

From this chart, there are also a number of notable observations:
- Work from home-remote office networks have a much higher prevalence of modem and router management protocols typically enabled by default on many consumer modems, most often provided to consumers by their ISP, such as TR-069 and TR-064 protocols operating on port 7547 and other customer-premise equipment remote management protocols as also observed on port 4567. These make little appearance on company networks as organizations often control the hardware for their egress Internet services and subscribe to different services. 15.4% of WFH-RO IP addresses have exposed cable modem control interfaces when you include the IP addresses that do not have any service exposed. This number increases further when HTTP-based control interfaces are taken into account.
- On the other hand, web-based services are also commonly exposed on these networks, and while they are not inherently a negative observation, the purpose of these web services is an important artifact to understand. We can also see in the chart above that port 8080 and 8443 are more common in relative terms. In fact, of the WFH-RO IP addresses that have a web service exposed, at least 22% of those are a consumer modem or router administrative interface.
- Devices participating in BitTorrent activities (port 6881) are much higher relative to company networks. One of the reasons we assess illegitimate file sharing as part of the Security Rating is due to the increased exposure organizations face through permitting this activity.
- There is a higher relative prevalence of Real-time Streaming Protocol (RTSP) on residential networks, a protocol for video streaming, in comparison to company networks. In context to residential networks, this is not the protocol associated with common video streaming services like YouTube, Netflix, or Twitch, but the protocol used by IoT devices such as cameras.
- Telnet is more prevalent on WFH-RO networks when compared to corporate networks due to remote interfaces being accessible on home consumer routers. Telnet is an old remote access protocol that is often inadvertently accessible on many IoT devices with little value provided back to the user, especially residential networks, as it has been a channel of attack for many years.
Compromised Systems
The presence of compromised devices on corporate networks is strong evidence of poor security hygiene or failed controls, particularly on endpoint workstations whose risk is often concentrated in the maturity and configuration of the endpoint protection technologies federated across the operating system protecting that device, as well the education and knowledge distilled into the individual users of those devices. For this reason, we continuously research and monitor the devices infected by botnets associated with currently over 250 active malware families spread across the world. This wide visibility into infected systems forms a core component of how we measure the cybersecurity posture of organizations.
We previously reported that we observe approximately 90% of malware infections on service provider networks. However, that research did not explore the differences between security controls on corporate networks, as compared to associated home networks. Unlike the analysis of the network perimeter where we had collected all corporate assets into one group and the WFH-RO IP addresses into another group, we split those assets into independent maps based on companies. More specifically referring back to the graphs shown above, for each organization we treat all the blue nodes as representative of the corporate company map, or “corporate networks,” while we treat all black nodes as representative of the “work from home-remote office (WFH-RO) networks,” and treat each group as a single entity. Each company thus has a map representing their corporate assets and another map representing their WFH-RO assets.
With this in mind, we can compare the malware behavior between those two groups for each company, as well as the wider population, by joining our compromised systems telemetry from March 2020 onto these asset maps. The following scatter plot shows the distribution of companies and their respective family counts between both of their asset types. Each family is only counted once when it is observed during that period, even if it affects multiple devices or occurs across multiple days. Each dot represents a single company in the study.
-3.png)
During this period 13.3% of companies had at least one observation of a malware family on their corporate network for the families we observe, while 45.0% of companies had at least one observation of malware family on their WFH-RO networks. 2.3% of companies had observations of at least 5 distinct families on their corporate network while 17.3% of companies had at least 5 distinct families observed on their WFH-RO networks.
As the number of WFH-RO IP addresses associated with a company increases, we observe more unique malware families on both the WFH-RO networks and the corporate networks..png)
This relationship reflects the fact that the count of home IP addresses acts as a rough proxy for the size of an organization. As the size of the organization increases, so does their complexity at managing infrastructure, processes, and human practices within the physical and digital boundary of the corporate network. However, the size of the organization also has a much more rapid relationship to the diversity of malware families that their assets are exposed to outside the corporate network and in residential networks.
The second component we wanted to investigate was the characteristics of the individual malware families. More specifically, we wanted to determine whether there are families that are observed more frequently on residential networks and less likely on corporate networks and vice-versa. The following plot shows the number of company asset maps that each family was observed on, with the Y-axis representing the count of WFH-RO networks and the X-axis representing the count of corporate networks.
.png)
In general, every family was observed more frequently on WFH-RO than on their corporate network counterparts. As malware families drift away from the center line towards the top-left they generally appear more frequently on consumer networks while those families that are further to the bottom-right have a tendency to be seen relatively more on organizational networks.
These preferences are generally representative of the types of devices and software that these malware families target, and we see this reflected in the frequency and infection targets of those families:
- The examples highlighted in blue are malware families and potentially unwanted applications affecting mobile platforms (Hiddad, Mobidash, ArrkiiSDK). The types of devices these families target often rely upon users running older devices, or following poor security practices, such as side-loading applications, which might be prohibited on corporate devices managed by MDM solutions with stricter policies.
- The examples highlighted in yellow are those that target IoT devices (Mirai and RootSTV) or consumer devices (QSnatch). While corporate devices have their share of IoT devices present, they are often better managed than those owned and operated by consumers. Mirai gained prominence and its effectiveness not from its rapid exploitation of a new vulnerability, but in part from taking advantage of devices in default states or other devices with poor configurations.
- The examples highlighted in red are those affecting Windows platforms (CrossRider, Trickbot, Necurs) which have a higher prevalence in corporate networks compared to the other two sets.
These characteristics give us visibility on the likelihood of the environment for which we would observe a given family. For example, Mirai is observed at least 20.1 times more frequently on WFH-RO networks than corporate networks, QSnatch is observed 29.7 times more frequently on WFH-RO networks, while Necurs and Trickbot are observed at least 13.8 and 3.8 times more frequently on WFH-RO networks than corporate networks respectively.
Conclusion
While the notion of a single trusted network that corporate workstations exclusively operate in has been fading over the last decade, there are certainly challenges that organizations are going to face who haven’t dealt with such diverse environments. Given the circumstances of the last several months, these devices have now abruptly moved into environments with a different set of unique entries into the local network on a persistent basis, and organizations should be aware that their cybersecurity policies, practices, and education should be aligned with these new operating environments.
Worms, particularly those that have been developed as ransomware, have become a recent concern amongst many practitioners and network operators, due to the ability to spread onto unpatched systems once they gain entry to the local network. The success of these families infecting many other systems internally reflect the disparity of attention paid to the corporate perimeter versus the health of the individual workstations and endpoints. Defense-in-depth strategies are also now more complicated and difficult to implement as security and network operation teams already had to balance the technology and configurations they deploy against the freedom that the various functional teams at companies need to be successful.
From this study, and as a course of general best practices, the following set of recommendations are put forward:
- Reduce over-dependence on a local trusted network and physical-based network controls. Companies and organizations who have focused much of their security-based program on the perimeter should ensure they invest in technologies and operations that better harden the workstation, services, and sensitive data while still enabling the business to be successful remotely. Organizations who have already adopted the zero trust security model into their culture and security programs will likely see the least change in their threat model.
- Improve and execute on patch management programs for both workstations and servers. New vulnerabilities will continue to be discovered, published, and weaponized throughout the next several months and it will be as important now as it was historically to continue to update and patch systems that might now be more vulnerable to attack.
- Continue user education and training. Malicious actors will capitalize on the fear around COVID-19 and users should be continuously educated and reminded of the methods that use them as a vector of attack. Make them aware that these threats and best practices extend beyond the corporate network and into the home. Encourage users to also follow best practices offered by manufacturers of their own personal devices to further limit the attack surface exposed to corporate devices. Consider sharing specific recommendations and best practices directly with employees.
To See More Data, Visit Our Remote Office Risk Infographic or read the white paper below.