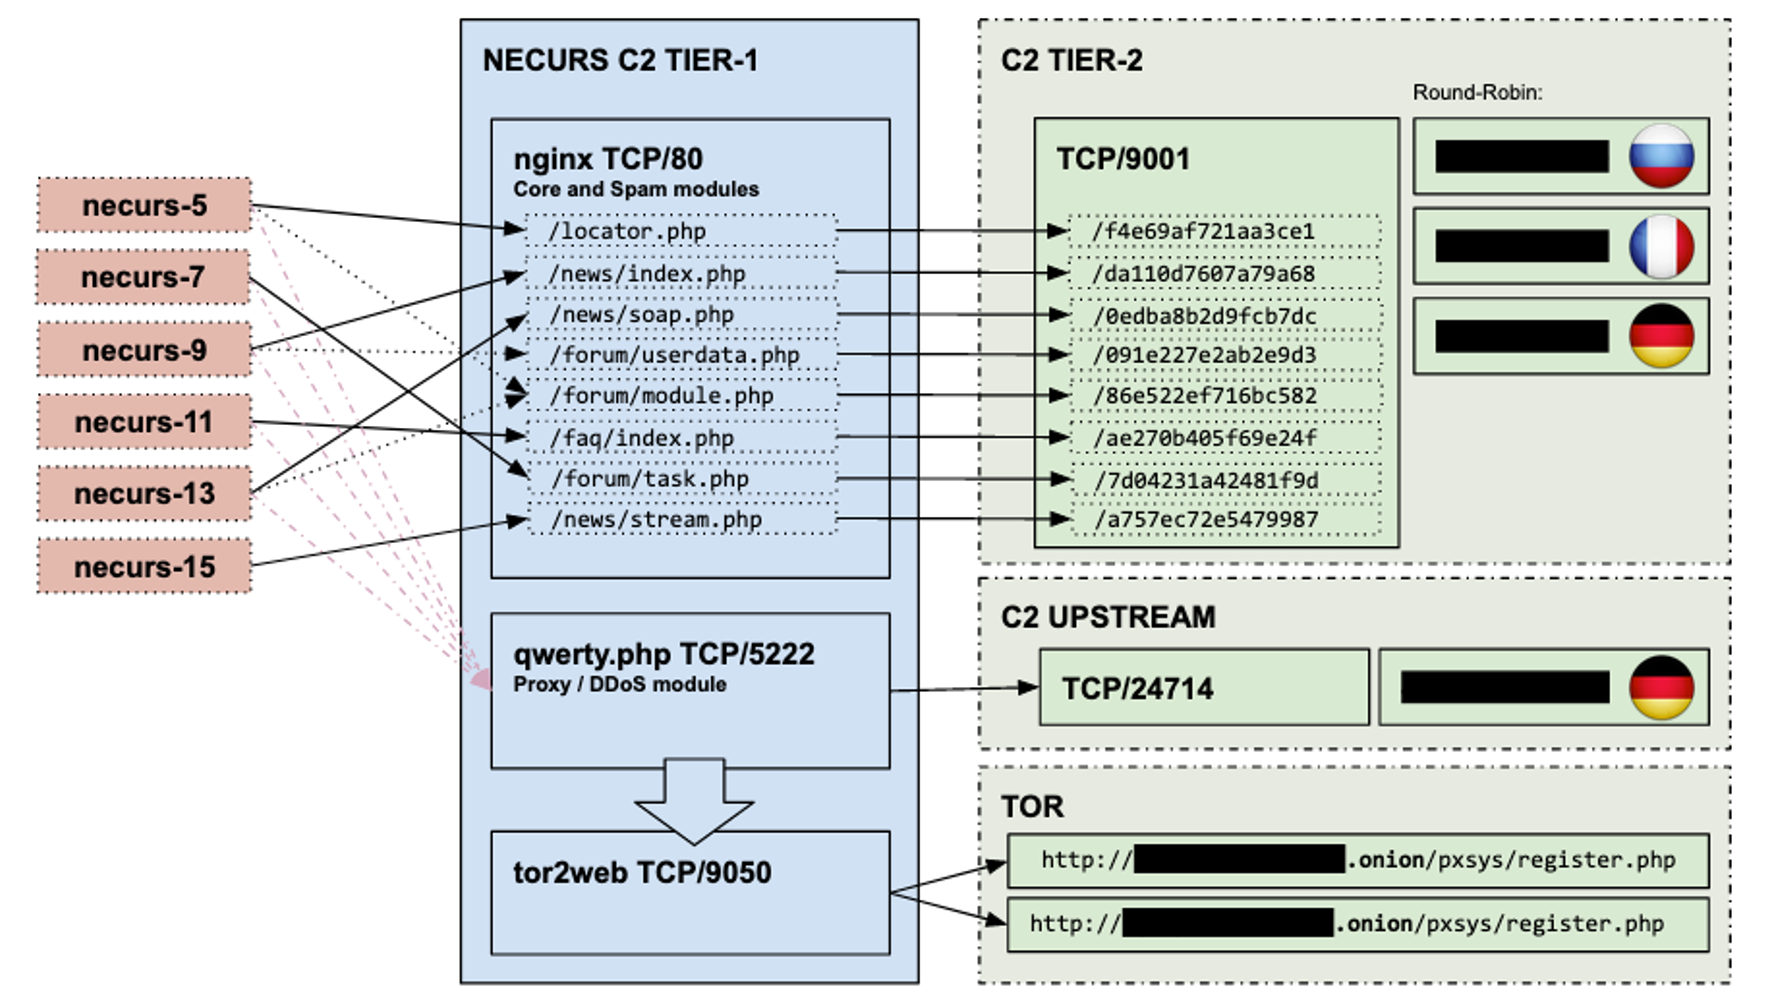
Since 2017 Bitsight has been working together with Microsoft’s Digital Crimes Unit (DCU) to understand the inner workings of the Necurs malware, its botnets and command and control infrastructure in order to take disruptive action against the threat, including reverse engineering, malware analysis, modules updates, infection telemetry and command and control updates and forensic analysis. This week, an action took place to disrupt all Necurs botnets, followed by mitigation and eradication actions.
The Malware
Necurs was first detected in 2012. It’s used in a variety of illegal activities, but it is primarily known as a dropper for other malware, including GameOver Zeus, Dridex, Locky, Trickbot and others. Its main uses have been as a spambot, a delivery mechanism for ransomware, financial malware and for running pump and dump stock scams. From 2016 to 2019, it was the most prominent method to deliver spam and malware by criminals and was responsible for 90% of the malware spread by email worldwide.
The malware infects a victim’s system by being dropped by other malware, through either spammed email attachments or malicious advertisements. Once on a system, Necurs utilizes its kernel mode rootkit capabilities to disable a large number of security applications, including Windows Firewall, both to protect itself and other malware on the infected system. Necurs is modular, in that it allows the operators to change how they operate it over time.
Its botnets appear to be closely controlled by a single group. During our investigation we have identified eleven Necurs botnets; of these, four are the most active and constitute approximately 95% of all infections. Since March 2019, the Necurs botnets’ activity stalled but left an estimated 2 million infected systems in a dormant state waiting for the botnets to revive. It’s not unusual for Necurs to stall operations from time to time, but it has never happened for such a long period of time until now.
Infection Telemetry
Bitsight’s unique ability to observe massive global infections is the reason why law enforcement and private sector organizations have worked with us over the years on significant disruption initiatives.
Back in 2016, we discovered that Necurs had around 1 million infected systems. Shortly after that post we had the opportunity to see a much bigger infection base of around 2 million infected systems in a 24 hour period. Measuring infections for Necurs is not as simple as for other malware; this is due to how the malware establishes communication with its command and control (C2, see below) and how our sinkholes collect this information. The communication from the infected machines would not reach out to us always, so only in rare occasions we have full visibility of all the botnets. On normal days of Necurs operation, our daily infection counters are below 50k infected systems when there are active C2s, and between 100k-300k when not. Even when under circumstances where we do receive a higher number of connections from infected systems, the daily unique observations continue to be an underestimate of the true size of the botnet, but it stills enables the ability to approximate those changes over time. After March 2019, when active C2s were last seen, we observed a slight decrease in infections overtime.
The following chart shows the evolution over the last years of how many infected systems reached out to our sinkholes:
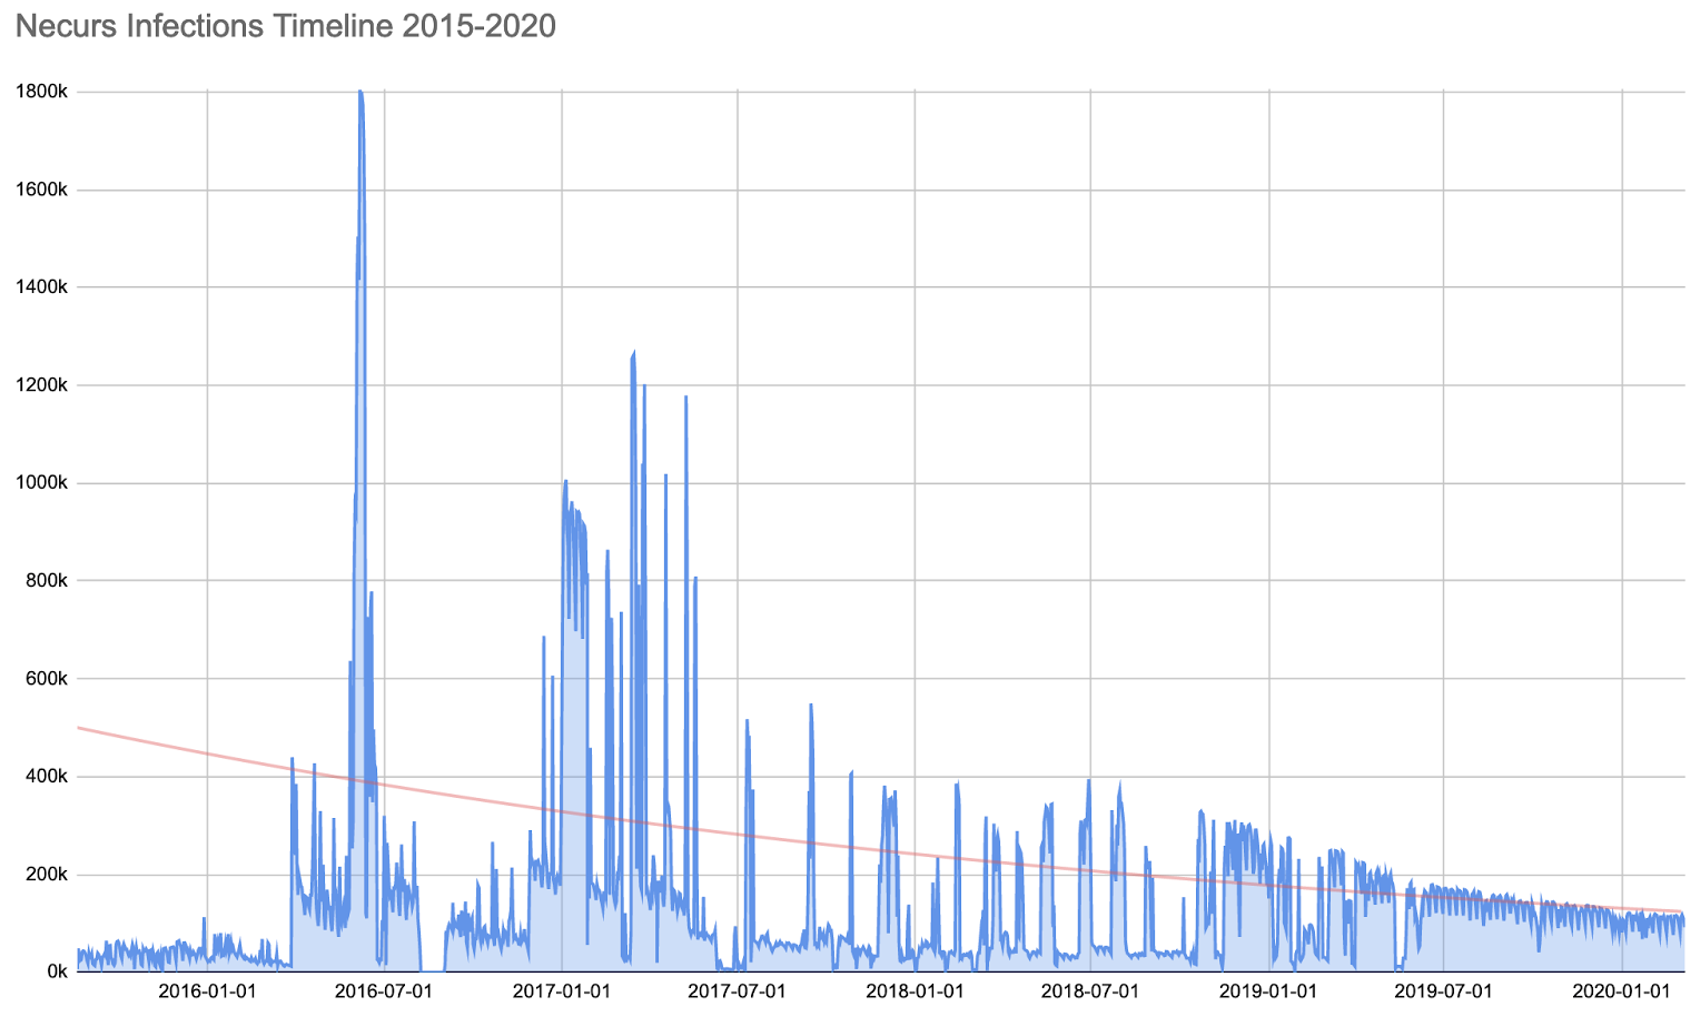 Necurs infections observed in the last years in Bitsight sinkholes
The following map shows how a week of Necurs infection telemetry is dispersed geographically:
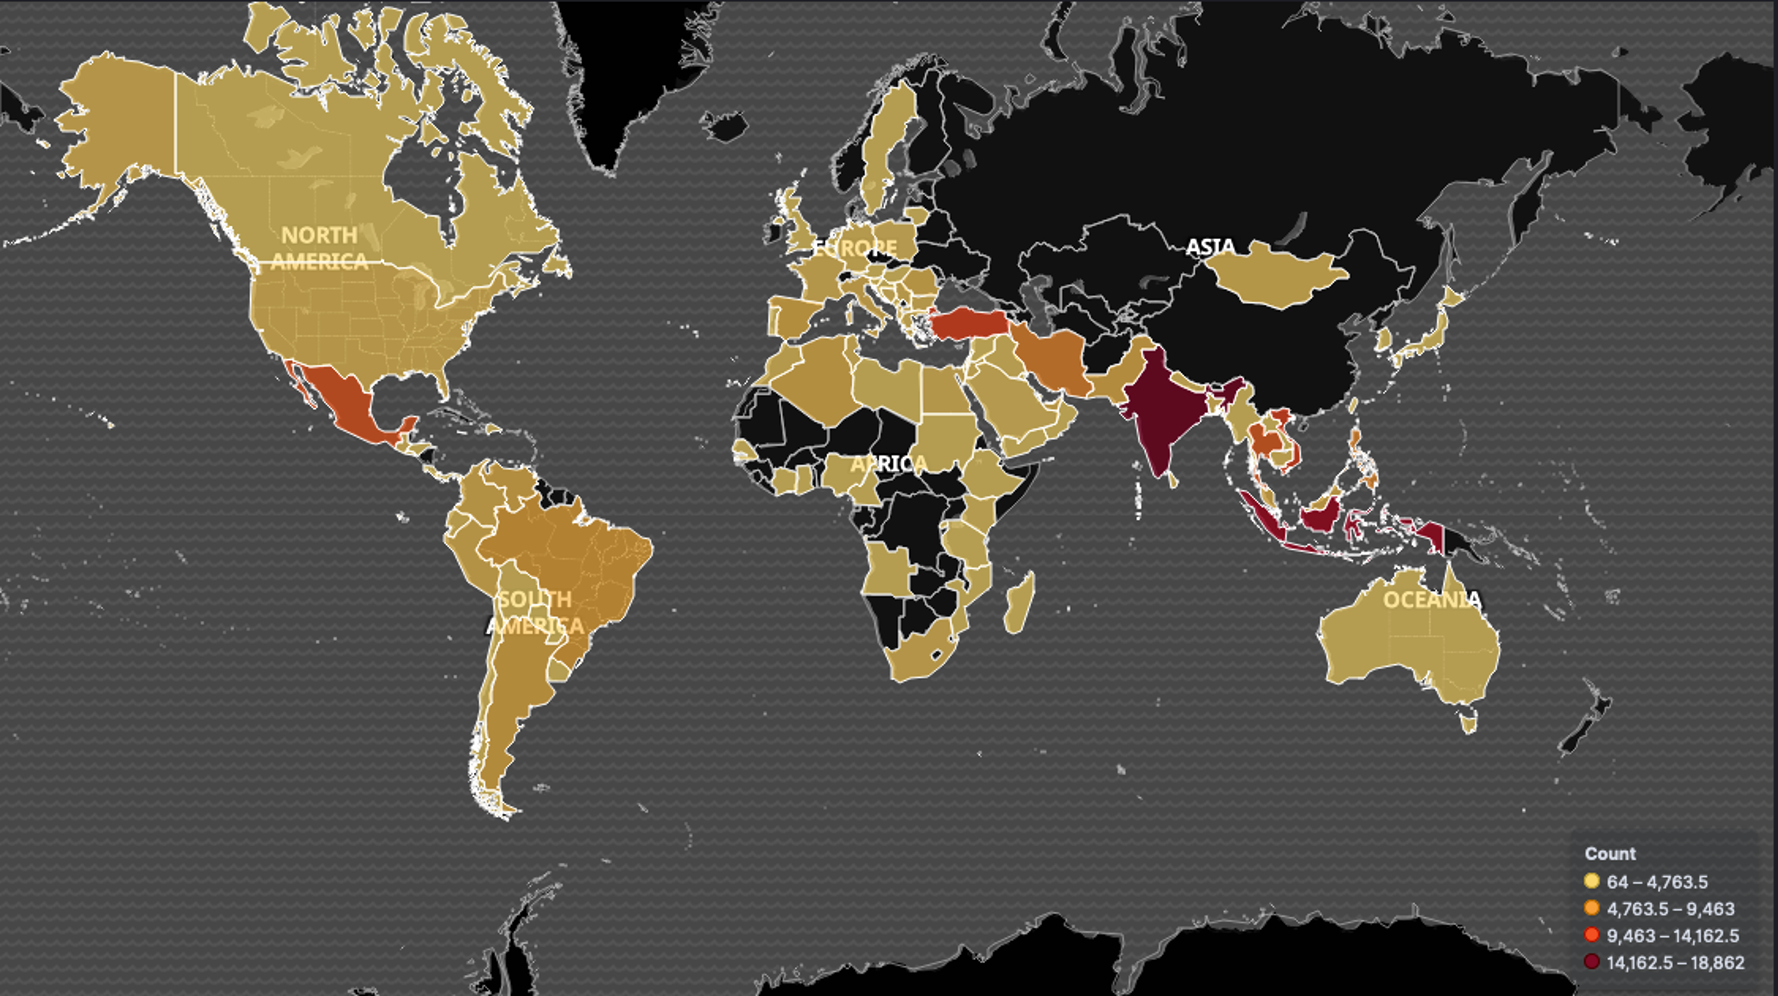 Geographic distribution of Necurs infections
The breakdown by countries for the first seven days of March 2020 is given by the following table where the infection counter is measured by distinct IP addresses reaching our sinkholes - as stated above the botnets are bigger and these numbers cover only a part of them:
|
Country |
Infections |
% |
|
India |
90563 |
13.59% |
|
Indonesia |
69530 |
10.43% |
|
Turkey |
51605 |
7.74% |
|
Vietnam |
49190 |
7.38% |
|
Mexico |
40129 |
6.02% |
|
Thailand |
37081 |
5.56% |
|
Iran |
32807 |
4.92% |
|
Philippines |
24097 |
3.62% |
|
Brazil |
16122 |
2.42% |
|
Pakistan |
11311 |
1.70% |
|
Argentina |
11289 |
1.69% |
|
Spain |
10223 |
1.53% |
|
Venezuela |
9825 |
1.47% |
|
Algeria |
9806 |
1.47% |
|
Malaysia |
8250 |
1.24% |
|
Colombia |
7832 |
1.18% |
|
Italy |
7640 |
1.15% |
|
Romania |