SLP Denial of Service Amplification - Attacks are ongoing and rising
Tags:


Key takeaways
- CVE-2023-29552 is being actively exploited on over 1,000 systems by unknown threat actor(s) on a regular basis.
- Distributed Denial-of-Service (DDoS) attacks abusing this protocol design flaw have doubled in frequency and grew tenfold in bandwidth since October.
- Cloudflare reports observations of several attacks as high as 105Gb/sec.
- Netscout has observed more than 220 SLP reflection/amplification attacks ranging up to 38Gb/sec so far.
- Targets include cloud crypto wallets, banks, stock exchanges and game servers.
- There is evidence that attackers are getting more sophisticated in their toolset.
Introduction
The Service Location Protocol (SLP), as defined in the RFCs, is vulnerable to abuse allowing attackers to use it as a powerful reflective denial-of-service amplification vector. Earlier this year, Bitsight and Curesec published a joint research regarding this flaw tracked as CVE-2023-29552, which details the issue as well as its global impact and exposure. Back in April, CISA issued a warning about the potential for abuse of SLP and, roughly one month ago, the CVE-2023-29552 was added to the Known Exploited Vulnerability Catalog.
In this blogpost, we build on our previous work and look into how threat actors are abusing SLP to launch reflection/amplification DDoS attacks, their evolution, and what targets are they focused on at the moment.
Analysis
We’ll start by taking a deeper dive into the technical details of this design flaw. What makes this flaw particularly dangerous is its extremely high amplification factor that allows for an under-resourced threat actor to have a significant impact on a targeted network and/or server via a reflection/amplification DDoS attack.
For a reflection/amplification DDoS attack to properly work, two conditions must be met:
- Reflection: the attacker must somehow direct the attack to its intended target. Usually this is done via IP spoofing and UDP based protocols are, by nature, vulnerable to IP spoofing.
- Amplification: the attacker should be able to generate the maximum amount of traffic using a minimum amount of bandwidth.
An effective attack using SLP as a reflective amplification vector happens in two steps. First an attacker has to make sure that a vulnerable server instance memory grows as much as it can. He does that using Service Registration packets. This is called priming the vulnerable server (also called reflector in this use case) and assures that the server replies are as big as possible for the protocol, hence growing the amplification factor (Step 1 in figure 1). After that priming activity, the attacker is free to send spoofed Service Type Requests packets, which take only 29 bytes, making the server reply to its intended victim with huge replies that can reach up to ~65.000 bytes (Step 2 in figure 1)
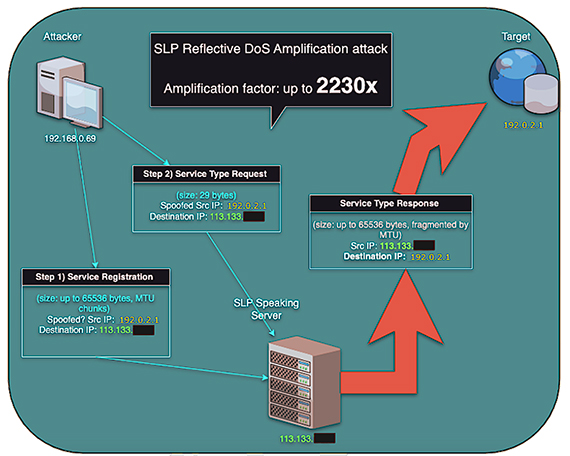
One interesting and important detail is that the service registration has a maximum lifetime of 65,536 seconds, or around 18.2h. After that period, the server will de-register the service, which essentially means that the replies will cease to be as big and the amplification factor drop, making the attack less effective. This means that any attacker wanting to have a sustained attack has to redo the priming activity regularly. Another aspect of this two step attack is that the attacker can spoof both the IPs used for priming as well as the needed ones used for target selection. This makes tracking down the attackers a hard task.
Back in April, when we first disclosed the protocol design flaw, we decided that we wanted to monitor its evolution and try to detect its abuse. There are several approaches on how to do it, but we will essentially focus on two: monitoring the priming activity and packet metadata analysis.
Priming activity
Since we are regularly scanning the Internet at scale, we have identified the IP addresses that have SLP port and protocol publicly exposed. Knowing the addresses of the affected servers (or reflectors), one thing we can do is monitor each server reply when a valid Service Type Request is issued. This allows us to do two things: we can roughly fingerprint the server and analyze the reply and its size. If the reply size starts to grow in a suspected way, we can detect if the server is being primed.
Normal server reply:
% ./slpload.py -t 3 -m check -l 95.110.XXX.XXX

[+] Sending service type request v2...

[+] Data Buffer: b'\x02\n\x00\x00d\x00\x00\x00\x00\x00\xd2\xe3\x00\x02en\x00\x00\x00Pservice:wbem:https,service:management-

hardware.Lenovo:lenovo-xclarity-controller'

[!] Host: 95.110.XXX.XXX Buffer Size: 100 Ampfactor: 3.4482758620689653
Primed server reply:
% ./slpload.py -t 3 -m check -l 217.174.XXX.XXX

[+] Sending service type request v2...

[+] Data Buffer:

b'\x02\n\x00$\x97\x80\x00\x00\x00\x00\xa0@\x00\x02en\x00\x00$\x83service:VMwareInfrastructure,service:wbem:https, 37b95357B412://8aE8bcdD7a5b:25896/cce5ae197C8cbFFD37D5DC9eAe5dD68BBf78bBdEbb81c2f9ED2fBb3b8CE8355337B9dFeFFB5cB995c5e7827c99B4dF56aae22F3DDadfDFdfD6AFeC2aCBc49eEb4F5e16dAaeB54cEc44FA6FE,4BbA6e79f2d6://812FcdF8ddD4:28010/FCeEb7EB8E94Fa886a73b87141fabbA68E79A54DA58e7Fe5eEabc4BdC91b5Ef282f4CACB65aef7Ed542c9863cb4b98dCA94c6dE84BDc8e8be7311274CbAEE9B62dD5aF69CC927Da18BCa4bA,4ca29FFbC2a7://392Fa6F5374d:34790/Ea2b8DF2CdcFFE43B65f415d153Fd7D24aab5cdC786Ab57D4F3eDACa37fD6Ad1a88Edd7DB8dcB1baDe57F2fbDfc9DCaded4ff1d2Bb33BcEA27Bd9fFAAcDCCe1eaCdaABCFBeAc4eBBAA89FfF,35DCEB45bAd7://dbeB87D9eB9c:24259/FABf8DD6D6FaAe325E3Fd5dE739de1cc69167efAdB7fBA581FcCcB2792684Da4EB2dCd6eA1BdbC4CdDAfcDe6eCDF1B84E3bd8429A5Eabc28b741E56cBFc6CCe45B15ccAb65Ad3Ba2f2aEbDf,DCB37Dfcabea://F4ffFfc65aaA:41830/AEED5BC2EAb7f8eBb35Dfdd7D3E33f46f2D58D1aD2DbdE4B976CCcedea896d43f58956dbc1293117F514dE1AAc254a291BA41ff3dDF1AEAd26415A7b6aaCb85fcF9f9dc923fD79187bFfea6,Cf767A38Cafd://cd5eDCf9a4CE:38487/47a346F649Fd49626aD92dCe2AA3C8AE3e1dc3abA1298467dEBb9F8c6d6CE1FBBa24cca37e3B2D3cD8Ee79f1Af3cD355B5D33C1975b3618d298681cf3CAEC53cfBF5B84aA5853FdFfCa63D7,CE8acE7B88Ae://3F1135B9F3f6:17637/cDAab8d7d561B9bF8aDc153fF9Ae86De9Ca3f7A6A2E23F1EeA2EB84875EdECaBE5D5Ab8b77bDbF19EbB1d4928789F2BA2D787AA3bADd8bA4f56A15c9e74fce24d9a8B85afcFF28296AdF3eF,E7132FbA2fAF://9155E6aCe5A2:39'

[!] Host: 217.174.XXX.XXX Buffer Size: 1400 Ampfactor: 48.275862068965516
In the second reply above, highlighted red, we can see several fake services that have been registered by an unknown threat actor with the sole purpose of growing the servers cache, result of an ongoing priming activity.
If a significant number of exposed servers start to be primed, we know that there is a high probability that an attack is being prepared. In this way, we can use the ‘global servers' reply size as an early warning system on emerging SLP reflection/amplification DDoS attacks. So we started to actively monitor reflector replies at a global scale to try to understand what would happen.
Very little activity was detected for several months, only the occasional use of the open source tool that was published by Curesec to perform self-testing of your own servers and maximum amplification factor.
On September 7th, late at night, something very different happened. More than 5,000 reflectors were primed all over the world, and that activity continued for a couple of days before it stopped.
This activity only lasted for two days before it went silent again. It may have been a test run for what we are now seeing today.
On October 11th, the priming activity started again and, since then, it never really stopped (except a brief period on Oct 26 and Nov 14).
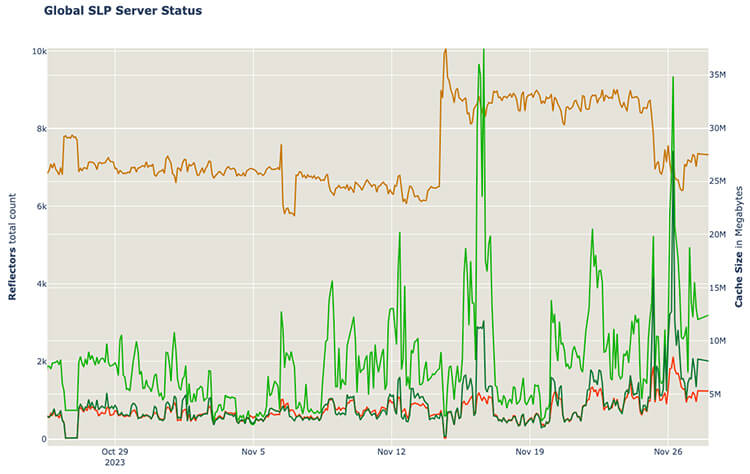
At this moment, our monitoring usually detects around 1,000 primed reflectors (red line) at any given time, with a slightly growing tendency detected over the last weeks. This sustained activity indicated that either the threat actor(s) were engaging in active attacks or they wanted the infrastructure ready for on-demand attacks. One interesting detail on how some implementations of the SLP protocol work is that if someone tries to use up all the available servers cache to achieve the maximum amplification possible, the actual server reply will get truncated, effectively reducing the amount of amplification possible. This difference between what should be returned by the vulnerable server and what actually is returned, can be seen in the chart with the green lines. The lighter green line shows the “Cache Size'', the intended size that the attacker primed the server with. The darker green line is the “Usable Cache Size'' which is the actual returned reply size, the one that should be used if we are calculating the effective amplification factor.
This overall priming behavior has led us to do a more detailed analysis on what could be happening.
Packet metadata
By looking at large scale packet metadata samples regarding SLP traffic, we could observe some interesting patterns. Packet metadata only includes a timestamp, source and target IP/port pairs, packet count and size. Still, this can be used to understand uncommon traffic patterns and anomalies.
If we look at the total sampled amount of SLP traffic involving vulnerable reflectors, we can immediately spot major events at specific days. In the chart below, notice the green vertical line when the last major priming event occurred and never stopped again, October 11th. There is not much noticeable traffic around that time, in part because the November 16th event almost obfuscates everything else but also because in this chart we are observing total traffic, which involves DDoS attacks attempts hence large packets.
(Figure 4)
By the cadence of the traffic spikes, we can observe that events generating a huge amount of SLP traffic (red vertical lines) are rapidly becoming more common. We also wanted to understand how the priming activity could be measured in the sample and, at the same time, how good our sample actually was. To achieve that, we filtered the sample to only consider packets that have 46 bytes in size (or equivalent bytes per packet ratio). Why 46 bytes? Well, if you recall how the attack works, the vulnerable servers have to be primed before an attack, having multiple fake services registered. When a Service Registration packet is processed by a vulnerable server, it replies with a Service Acknowledge packet. We don’t know the size of the attacker controlled Service Registration packet, but we do know that the Service Acknowledge packet layer 3 size has to be 46 bytes (20 bytes IP + 8 bytes UDP + 18 Bytes SRVLOC), as per RFC:
10. Service Acknowledgement Message Format
A Service Acknowledgement is sent as the result of a DA receiving and

processing a Service Registration or Service Deregistration. An

acknowledgment indicating success must have the error code set to

zero. Once a DA acknowledges a service registration it makes the

information available to clients.

0                   1                   2                   3

0 1 2 3 4 5 6 7 8 9 0 1 2 3 4 5 6 7 8 9 0 1 2 3 4 5 6 7 8 9 0 1

+-+-+-+-+-+-+-+-+-+-+-+-+-+-+-+-+-+-+-+-+-+-+-+-+-+-+-+-+-+-+-+-+

|        Service Location header (function = SrvAck) (16 bytes) |

+-+-+-+-+-+-+-+-+-+-+-+-+-+-+-+-+-+-+-+-+-+-+-+-+-+-+-+-+-+-+-+-+

|          Error Code (2 bytes) |

+-+-+-+-+-+-+-+-+-+-+-+-+-+-+-+-+
So, by monitoring the packet samples that only have 46 bytes, we can understand the registration responses and have a very good idea of the priming efforts. If this correlates with the actual measured content of the reflectors that we are monitoring, then it will also provide an indication on how good our sample is, and the conclusions we can make by analyzing it.
In reality, this method proved to be even more effective than we anticipated, as the October 11th event shows cleary on the chart below:
(Figure 5)
The priming activity that we measured by monitoring the reflector's memory cache size is shown on the chart (in solid orange) and, once we apply the proper size filtering on the packet metadata sample analysis, we can see that the sample byte amount (in dotted orange) follows almost the exact same pattern as the cache we actively measured.
We can use the interactive chart to also compare the packet count from the sample and the primed reflector count that we’ve observed. It also follows the same pattern, as expected. These consistent observations increased our trust in the traffic sample and conclusions that can be made by studying it.
Observations
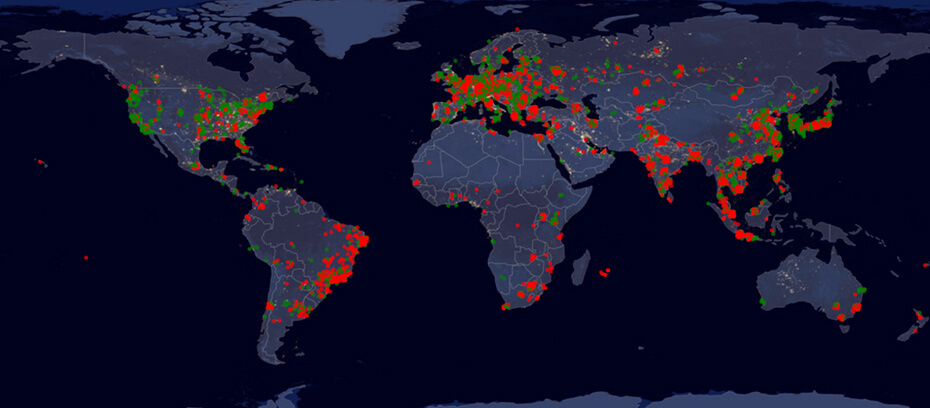
By mapping out the IP addresses on the outgoing end of the primed reflectors, it is possible to have an idea of who is being targeted with DDoS attacks. During the last two months, there have been some attacks already across most industry sectors.
Targets
By far, the most significant attack seems to have happened on November 16th, when a cryptocurrency website and wallet service hosted on a major Cloud Service Provider (CSP) was attacked, as well as a set of online game related servers. In addition, smaller scale attacks focused on the Finance sector, banks and stock markets were also detected, targeting Japan, Brazil and Germany among other countries.
Other noteworthy attacks were against a major retail company in China and a school system in the UK. Smaller scale attacks include Tourism, Consumer Goods and Transportation companies in Brazil.
(Figure 6)
If we try to understand which services are being attacked, we can look at the target destination port as an indicator of the target for denial of service. In many instances the service running is actually TCP and not UDP. The attacker might just use the port anyway in an attempt to bypass badly configured firewall rules and just generate enough traffic to slow down the entire server. Let's look at the main port targets in October:
(Figure 7)
As we’ve noticed before on Figure 4, October 15 and 18 registered a significant amount of traffic, although as it can be seen, the target services were completely different. The first was a multiport attack in the 7780-7828 range, while the latter was a ‘standard’ DoS on known HTTP/HTTPS service ports.
The ports targeted in November are not only different, but also the dramatically increased scale of the attacks:
(Figure 8)
The November 16th event is self-evident, due to its size. But the size is not the only peculiarity, the most targeted port is also not very common: port 503.
Port 503 is used in Intrinsa, MCode/TCP, an Industrial Control Device protocol. However, after careful analysis, this seems not to be the case nor the target service. The targets were related to a set of educational game server IP addresses.
More ports and attacks can be observed, and besides the traditional targets like HTTP(S) and DNS services, there has been a recent focus on MySQL servers on port 3306. It is easier to observe if you use the interactive features to disable the highest traffic ports on the above chart.
Primers
Attribution is, by the very nature of the attack, a hard thing to do. Usually, there are few reasons for whoever is priming the reflectors to not spoof his own IP address. Still, mistakes can be made or operational restrictions make it more cumbersome to an attacker to go to lengths of hiding his own IPs.
With the care in mind to not jump into any conclusions, some observations can still be made. Regarding the IPs that are recurring, as in they didn’t change while sending large amounts of priming traffic, we could see the following trends:
(Figure 9)
The chart above has the bubbles sized by the amount of packets sent by an IP address and colored by the dates it was first detected, only the significant IPs with a large number of packets are shown. Choosing the coloring by dates makes it easier to observe that back in earlier October, we could see a large amount of packets coming from Brazil IP space. This pattern disappears after a couple of days. As to why we could observe this outlier (given source IPs can be spoofed), we can only speculate.
If we take into account the amount of different IPs used, instead of amount of packets per IP, we can observe a different pattern:
(Figure 10)
In this case, the source IPs observed are largely coming from Switzerland (38%), then the USA (16%) and Czech Republic (6%). These 3 countries account for 60% of all observed source IPs that engage in priming activities.
From current estimations, the USA has around 1.529B IPs (~40.8% of all publicly routable IPv4 space), Switzerland around ~27M IPs (~0.7% of all publicly routable IPv4 space) and Czech Republic around ~8.6M IPs (~0.3% of all publicly routable IPv4 space). The discrepancy from what we can observe is odd, as one would expect if the IPs were spoofed in a strictly randomized fashion, a pattern that is more consistent with the current IPv4 world distribution should surface in the observations.
This could be geographical bias in our sample or related to how the threat actor(s) are abusing the flaw. Or both.
We did observe a change both in the raw number of IPs used and their distribution from October to November, but still with little relationship to what would be expected for complete random IPs.
(Figure 11)
The amount of priming packets and IPs seem to be lowering, while the amount of primed servers slightly increasing, and attack scale greatly increasing, which might indicate that the threat actor(s) is getting better at the techniques needed to conduct effective attack.
Evolution
Another interesting aspect that allows us to suspect the fact that attackers are evolving is not only the way they have been priming the reflectors, but also with what content. By analyzing the payload of the fake services that are registered, there is a clear evolution. Back in May and September only occasional scans using the publicly available tool were detected. But the priming content has evolved.
At first the content was a variation of the public tool (or exactly).
As time went by, we occasionally saw the following format (total 185 bytes):
[A-Za-z]{12}://[A-Za-z]{12}:[0-9]{5}/[A-Za-z]{151}
Example:
yVaLkIRtgUCH://wwrkZtwqIgWp:21183/xLFlURbPdDeaidbtCfZpEAhcwASMuNJXKODVCuvcFmSRrdSKoUPCqMoLFGbgKUazQYEeWXijKtKKucikwxLDUcUbNzHzkXmppKkNpHtxdCakhloiMaXDyBgjpYMEUpmMoIRSdPgLmCqZwrhRlBcHcrN
Lately the service format we overwhelmingly observe is (also total 185 bytes):
[A-Fa-f1-9]{12}://[A-Fa-f1-9]{12}:[0-9]{5}/[A-Fa-f1-9]{151}
Example:
ffbFa1e3e7d6://c911ABFfC97e:20183/6AA8B5f99fAadEd1A72dBD9bdE3AaBC25a89dFc6a49fBeb818d2Cbde6d1D77ae242173B4f2a1Cbed14747EeF542fc14C23a8C9A1e27a4Bb296be8ad4C8576cFdD27BD41c2daD495BB3A9FbA
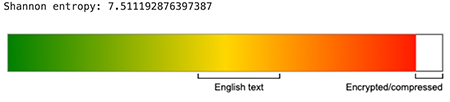
The size remains the same and overall format almost so, with the exception of the characters range being limited to [a-fA-F1-9], which could indicate some form of hex encoding. Interesting to note is the fact that zero is never used outside the port number part of the URL scheme. Without much more to go on and with the entropy of multiple samples quite high, these are probably random generated strings (or compressed/encrypted).
Nevertheless, the evolution points to a development of custom tools that are being used in the priming and, most likely, in the attacks.
Conclusions
It seems clear that SLP reflection/amplification DDoS attacks are on the rise. We can observe that both the frequency and bandwidth used is steadily increasing. Finance, Gaming and Retail seem to be, so far, the major focus areas for the attackers.
Attackers are also getting more experienced, using less traffic to achieve the same or higher success in priming the vulnerable servers and increasing the amount of reflected traffic that they are able to send to their intended victims.
The trend in having more and higher volume attacks is likely to continue, as there are still many available vulnerable servers reachable via the Internet and, hence, a lot more bandwidth to be exploited.
So far, from what we know, no major attack has been publicly reported.
Recommendations
If your organization has exposed devices that use SLP:
- Understand that your devices IPs and bandwidth can likely be abused by attackers to launch DDoS attacks on other devices and companies.
- Consider the need to have those devices exposed to the Internet.
- Consider the use of a firewall or VPN to restrict access to the device or SLP service.
General advice for organizations without devices that use SLP:
- Understand your external attack surface and make sure you have full visibility of your network resources.
- Keep an eye out for outstanding traffic on port UDP/427 & UDP non-initial fragments.
- Consider the different methods of mitigation of DDoS attacks and choose the one(s) that are properly suited for your organization.
Acknowledgements
Thanks to everyone in the operational working group for your thorough explanations, comments and feedback. Special thanks to the following people for their availability, analysis, constructive feedback regarding this protocol flaw and observed DDoS attacks leveraging it:
Alex Forster, Software Engineer DDoS Mitigation, Cloudflare
Damian Menscher, Security Reliability Engineer, Google
Roland Dobbins, Principal Engineer, Netscout’s ASERT Threat Intelligence team