Today’s security operations center (SOC) is a hub for monitoring and reporting on security vulnerabilities and incidents. Security professionals are used to looking at real-time data from their SIEM software, incident prevention and detection tools, security ratings platforms, and other technology solutions. Each product has its own dashboard of cybersecurity analytics and KPIs, giving teams quick access (in most cases) to the information they need to do their jobs effectively.
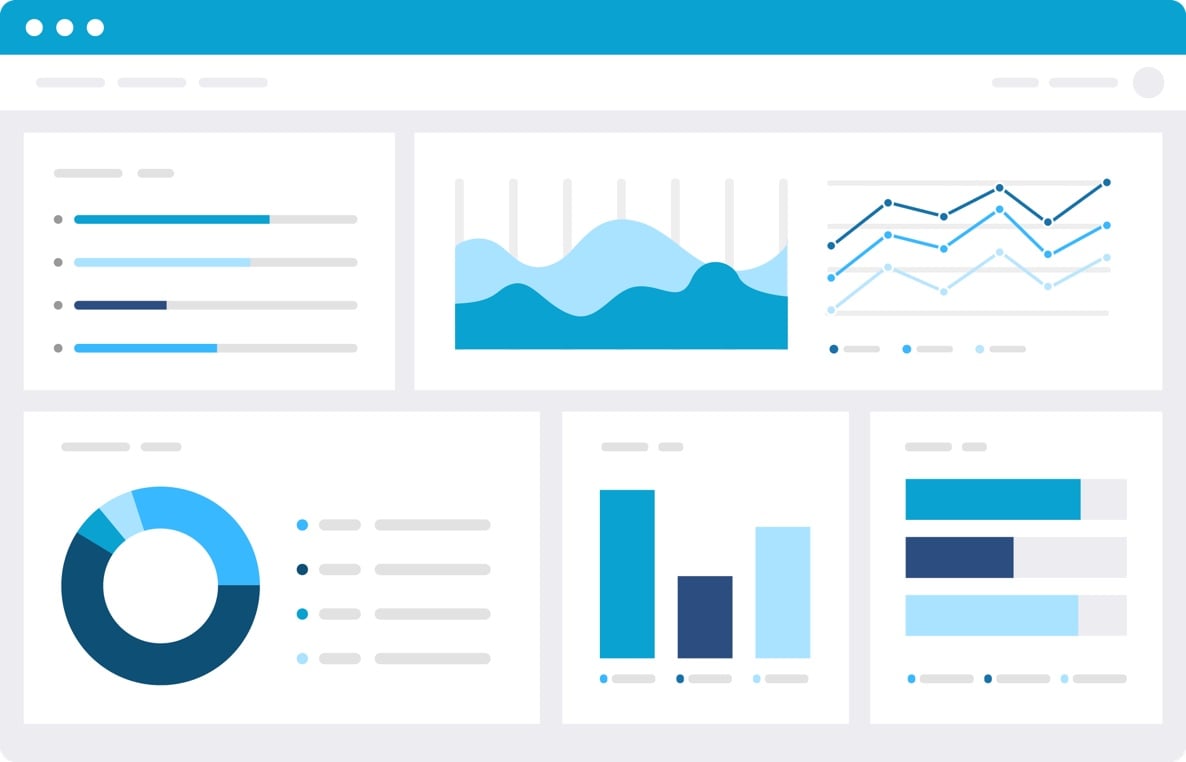
However, that’s not always the case. Oftentimes the data displayed by these tools is technical in nature. With less technically skilled individuals on the board and C-suite taking on increasingly important cybersecurity oversight roles, it is useful to provide a more straightforward, aggregated view of cyber risk. A cybersecurity dashboard is an effective way to do this.
By collating thousands of data points into easy-to-understand and accessible metrics, you can more effectively communicate the broad range of cyber risk your organization faces.
Here’s a list of the most commonly requested, relevant, and insightful KPIs that can be integrated into a cybersecurity dashboard to help anyone in your organization understand cyber risk at-a-glance, and how to to leverage them with Bitsight.
The 16 cybersecurity KPIs for your dashboard are:
- Security rating
- Botnet infection grade
- Peer-to-peer file sharing grade
- Open port grade
- Average vendor security rating over time
- Average industry security rating
- Intrusion attempts within a given period
- Patching cadence grade
- Mean time to detect (MTTD)
- Mean time to resolve (MTTR)
- Backup frequency
- Phishing test success rate
- Security awareness training completion rate
- Average security awareness training score
- Average password strength
- Number of unidentified devices on the network
1. Security rating
A security rating is a critical metric that describes your overall cybersecurity performance and supports rapid and meaningful decision-making by executives. A Bitsight Security Rating ranges from 250 to 900 with a higher score equating with strong security performance (ratings of 500 or lower are nearly five times more likely to experience a data breach than those of 700 or higher).
2. Botnet infection grade
A botnet is a collection of devices remotely controlled by cyber criminals or threat actors and is used to propagate spam and malware, execute DDOS attacks, and exfiltrate sensitive data. Bitsight Security Ratings can tell you what your botnet infection grade is (from A to F). A grade of B or below could mean you are twice as likely as A-grade companies to experience a breach.
3. Peer-to-peer file sharing grade
Peer-to-peer (P2P) file sharing can increase malware risk. Use Bitsight to find out how much P2P activity took place on your network in a given timeframe and compare your performance to other organizations – poor performance (on a grade from A to F) could expose you to increased cyber risk.
4. Open port grade
Your open port grade is an important KPI because it indicates how well-sealed your network is against intrusion attempts. Bitsight research shows that organizations with an F open port grade are more than twice as likely to experience a breach than those with an A grade. Refer to the Bitsight platform for your open port grade.
5. Average vendor security rating over time
Security ratings shine a light on risky vendors by continuously monitoring their security postures. Go one step further by using the Bitsight platform to find the average ratings of all your vendors and track them over a period of months or years so that the board can quickly see whether your third-party risk management program is getting results.
6. Average industry security rating
Seeing the average Bitsight security rating of your industry alongside your organization’s security rating can help contextualize cybersecurity performance. If your rating is lower than the industry average it may be a sign that your security program requires more investment and resources.
7. Intrusion attempts within a given period
This KPI can show how many intrusion attempts were detected or blocked – giving you valuable insight into the risk that your systems and data face on a daily basis. You can find this KPI in your intrusion detection and prevention system.
8. Patching cadence grade
Patching cadence measures how fast critical security patches are applied based on a scale from A to F. Found in the Bitsight platform, it’s an important KPI since a failure to apply patches in a timely manner (due to lack of resources or lack of diligence) can expose your organization to cyber risk.
9. Mean time to detect (MTTD)
MTTD is a measure of how long it takes the cybersecurity team or SOC to become aware of a potential security incident. The longer this timeframe the more likely it is that threat actors can access sensitive data and systems. Use your security incident and event management (SIEM) platform to track this metric.
10. Mean time to resolve (MTTR)
A measure of how long it takes to remediate a threat after it has been discovered. An increasing MTTR can indicate that you need to allocate more resources to the SOC. Find this metric in your SIEM.
11. Backup frequency
A measurement of how frequent backups are performed and an indication of your organization’s measure of preparedness. Certain cyber attacks are designed to destroy data. Frequent backups ensure that business interruption is averted. Find this KPI in your remote monitoring and management system or custom input.
12. Phishing test success rate
Phishing is a common risk vector for circumventing security controls and other defenses. A phishing test success rate tells you what percentage of your employee population is falling for phishing attempts, the human-related risk your organization faces, and the urgency of security awareness initiatives.
13. Security awareness training completion rate
Security awareness training can be time-consuming and tedious and is often put off. Tracking the percentage of employees that have successfully completed training is another important indicator of human-related risk.
14. Average security awareness training score
Viewing the average score for security awareness training can help you determine whether your employees are prepared and equipped to drive down cyber risk. Consistently low scores indicate that the training itself needs to be revisited and improved.
15. Average password strength
Your organization’s average password strength is a simple indicator of risk and a problem that can be easily resolved. Find this metric in your password manager.
16. Number of unidentified devices on the network
Remote work and BYOD policies mean that security pros have less control over unidentified devices which provide threat actors with an unprotected point of entry to the network. Network access control software can help you discover unidentified devices and inform remediation, such as policy changes or increased training.
Choosing the right KPIs for your cybersecurity dashboard
Every organization will have different KPIs, but some standard practices should apply across the board. As you build your cybersecurity dashboard, focus on metrics that help non-technical audiences understand the risks facing your organization. And ensure that your most important KPIs are easily calculated and exportable without requiring hours of manipulation.
You’ll notice that many of the KPIs listed above can be found in the Bitsight Security Ratings Platform. Bitsight makes it easy to achieve a single pane of glass view into cyber risk – both internally and across your vendor portfolio – so you can facilitate data-driven conversations with the board and C-suite about the risks your organization faces.