A Mere Five Percent of Vulnerable Enterprises Fix Their Issues Every Month: How to Help Them Do Better?
Tags:


Vulnerabilities in the Wild – More Widespread Awareness Correlates with Faster Remediation
Software vulnerabilities are one of the leading threats to an organization's cybersecurity posture, yet recent research from Bitsight reveals that enterprises affected by software vulnerabilities resolve them at a typical compound rate1 of only about 5% per month compounded continuously. However, there is evidence of much faster remediation for certain classes of vulnerabilities. Such are the findings from a study of 140 medium, high, and critical vulnerabilities, as identified by their Common Vulnerability Enumerations (CVEs), across a grand total of 101,201 enterprises.
These estimates of typical remediation timeframes for vulnerabilities are crucial, not only for reactive recovery planning in the face of disruptive events – such as the numerous cybersecurity incidents over the year to date – but also for developing realistic expectations and plans for patching vulnerable systems proactively. Bitsight’s industry-leading capabilities for long-term, Internet-scale vulnerability scanning have been leveraged in this study. Bitsight ratings serve as strong indicators of enterprise performance in key cybersecurity aspects like the proportion of vulnerabilities resolved and vulnerability remediation times.
Notably, coverage of vulnerabilities within alerts from authoritative organizations like the Cybersecurity and Infrastructure Security Agency (CISA) correlates with remarkable improvements in remediation times, superseding the aforementioned baseline performance of a 5% per month compound (instantaneous) remediation rate. Moreover, persistent discussion of vulnerabilities on social media forums, such as Twitter, also correlates well with greater awareness and impetus for remediation.
Two Remediation Pathways Emerge…
Preliminary results from the analysis are presented in Figure 1, which categorizes the 140 vulnerabilities2 tracked into medium, high, and critical severities, as per the Common Vulnerability Scoring System (CVSS). The respective sub-plots show persistence levels of vulnerabilities – as a percentage of the total number of enterprises affected – over time since first observation.
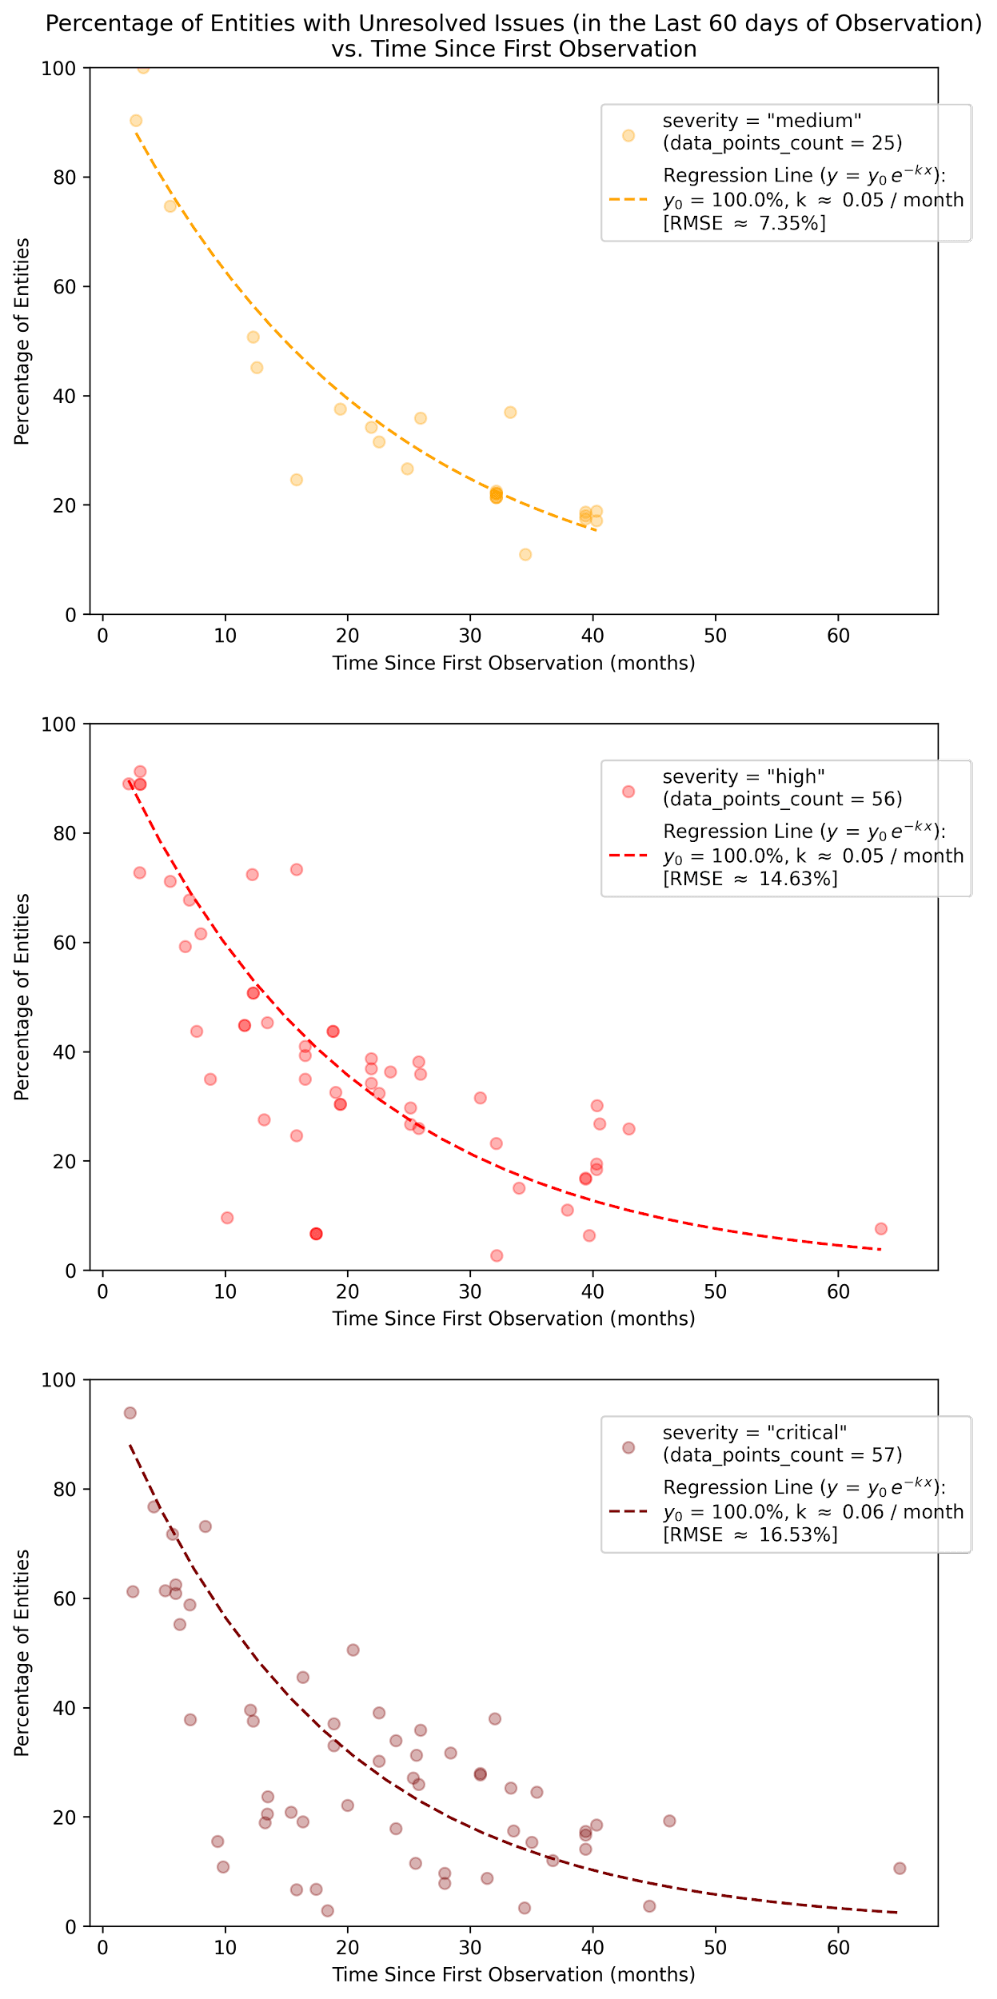
Figure 1 Percentage of Affected Enterprises as a Function of Time Since First Observation for medium, high, and critical Vulnerabilities (Regression Fit for high and critical Severities are Noticeably Poorer than for medium)
For medium severity, a pronounced trend of exponential-like decay is perceptible. For this, a compound (instantaneous) remediation rate of 5% per month can be estimated by regression analysis3. The regression line fits the data well, and produces a Root Mean Square Error (RMSE) estimated to be 7.35 percentage points.4
The cases for high and critical severities are more interesting, and less straightforward. Overlying exponential decay trendlines appear to be the limiting behavior of these data points, albeit with a considerable number of outliers beneath. Moreover, the overlying exponential trendlines seem to be very similar to the trendline deduced from medium-severity data. A naïve repetition of the regression approach from the medium case leads to considerably worse qualities of fit, and notably larger values of RMSE for high and critical cases5. Nonetheless, the compound remediation rate from the exponential decay trendlines is estimated to be very consistent across all severities. This strengthens the conjecture that the overlying exponential limit of remediation behavior is ubiquitous across severities – and is mixed with “rapid remediation” phenomena for some high and critical vulnerabilities.
The observed trendline and associated RMSE from the well-fitted medium case can be used to arrive at an operational definition of Rapid Remediation (RR) for high and critical cases, given strong similarities between the medium trendline and the limiting exponential decay seemingly overlying the high and critical points. Such RR regions are shaded green in Figure 2. These RR regions are defined as points that lie beneath the regression trendline from medium data and are outside the estimated 95% confidence interval thereof6. While data points in the RR regions are outliers for regression analysis, their properties are, arguably, more valuable for understanding what expedites remediation. Therefore, what may typically be discarded as “noise” is poised to be more valuable than what appeared to be the “signal” at a first glance.
Regression can be applied to high- and critical-severity points outside the RR regions in Figure 2 to validate the presumed behavior of the respective overlying limiting trendlines as being similar to the medium trendline. The monthly compound (instantaneous) remediation rates are found to be consistent at about 5% per month for both severities, with each regression line well-fitted to the respective data7, validating the presumption.
Figure 2 Percentage of Affected Enterprises as a Function of Time Since First Observation for medium, high, and critical Vulnerabilities with Delineation of Typical and Rapid Remediation Behavior8
Enterprises Seem to Respond to Timely and Authoritative Guidance on What to Fix!
As seen above, the typical compound monthly vulnerability remediation rate for enterprises is about 5%. The separation of rapid vs. typical remediation proposed in the last section leads to some remarkable details once the actual rapid remediation vulnerabilities are inspected.
In fact, most of the vulnerabilities involved in the rapid remediation regions are either associated with:
- Well-publicized security incidents from recent times, such as
- Pulse Secure (CVE-2021-22893),
- Hafnium (CVE-2021-26855, CVE-2021-26857, CVE-2021-26858, and CVE-2021-27065),
- Kaseya (CVE-2021-30116),
- F5 Big-IP (CVE-2020-5902 and CVE-2021-22986); or
- Ubiquitous technologies, e.g.:
- Apache HTTP Server (CVE-2021-41773 and CVE-2021-42013)
- Kubernetes9 (CVE-2019-11247),
- WordPress10 (CVE-2020-8772)
- VMWare11 (CVE-2021-21972), and
- Cisco WebEx12 (CVE-2020-3419).
Exploring coverage of the 140 vulnerabilities by briefings from the US Cybersecurity and Infrastructure Security Agency (CISA) sheds more light on rapid remediation. For example, CISA alert AA21-062A was issued for the Hafnium incidents aforementioned, while the Apache HTTP Server vulnerabilities were covered by a Current Activity advisory. It is observed that whenever a vulnerability is covered by an Alert or Current Activity advisory from CISA, it is 4.7x more likely to be selected for rapid remediation by enterprises (Cf. Table 1 for details).
|
|
|
|
|
|
|
|
While the boost in rapid remediations is encouraging, the responsiveness to CISA briefings at about 55% is only moderate, and something that may be improved further.
The insights gleaned can be summarized as follows:
- In the wild, the typical compound ((instantaneous)) remediation rate for vulnerable entities is approximately 5% per month.
- However, when guided by timely briefings (for high-impact vulnerabilities of severity high and critical), enterprises seem to affect rapid remediation over appreciably shorter timeframes.
- Organizations like CISA can serve as authoritative sources of guidance. Coverage in their briefings is observed to boost the prospects for rapid remediation of a vulnerability by 4.7x. Further improvements may still be possible.
|
|
|
|
|
|
|
|
|
Enterprises with Higher Bitsight Ratings13 Perform Better at Remediation
The Bitsight headline ratings, which are meant to be indicative of enterprise-level cybersecurity posture, are well-correlated with remediation performance, and can serve as useful indicators thereof.
From Figure 3, enterprises with higher Bitsight ratings are seen to be more comprehensive with their remediation, i.e. in terms of the remediation percentage of initially vulnerable systems. Progressive improvements are observed with better ratings. Entities rated 700+ are roughly 1.5x more comprehensive with their overall14 remediation of critical- and high-severity vulnerabilities than those rated 300-500. For rapid remediation, enterprises exhibit better comprehensiveness with their remediation efforts compared to the overall scenario. Nonetheless, those rated 700+ outperform ones rated 300-500 approximately 1.2x for critical and 1.7x for high vulnerabilities.
Also, the remediation of critical vulnerabilities seems to be slightly more comprehensive compared to that of high ones. Most importantly, the average remediation comprehensiveness for rapid remediation is conspicuously boosted over the overall performance for all rating buckets.
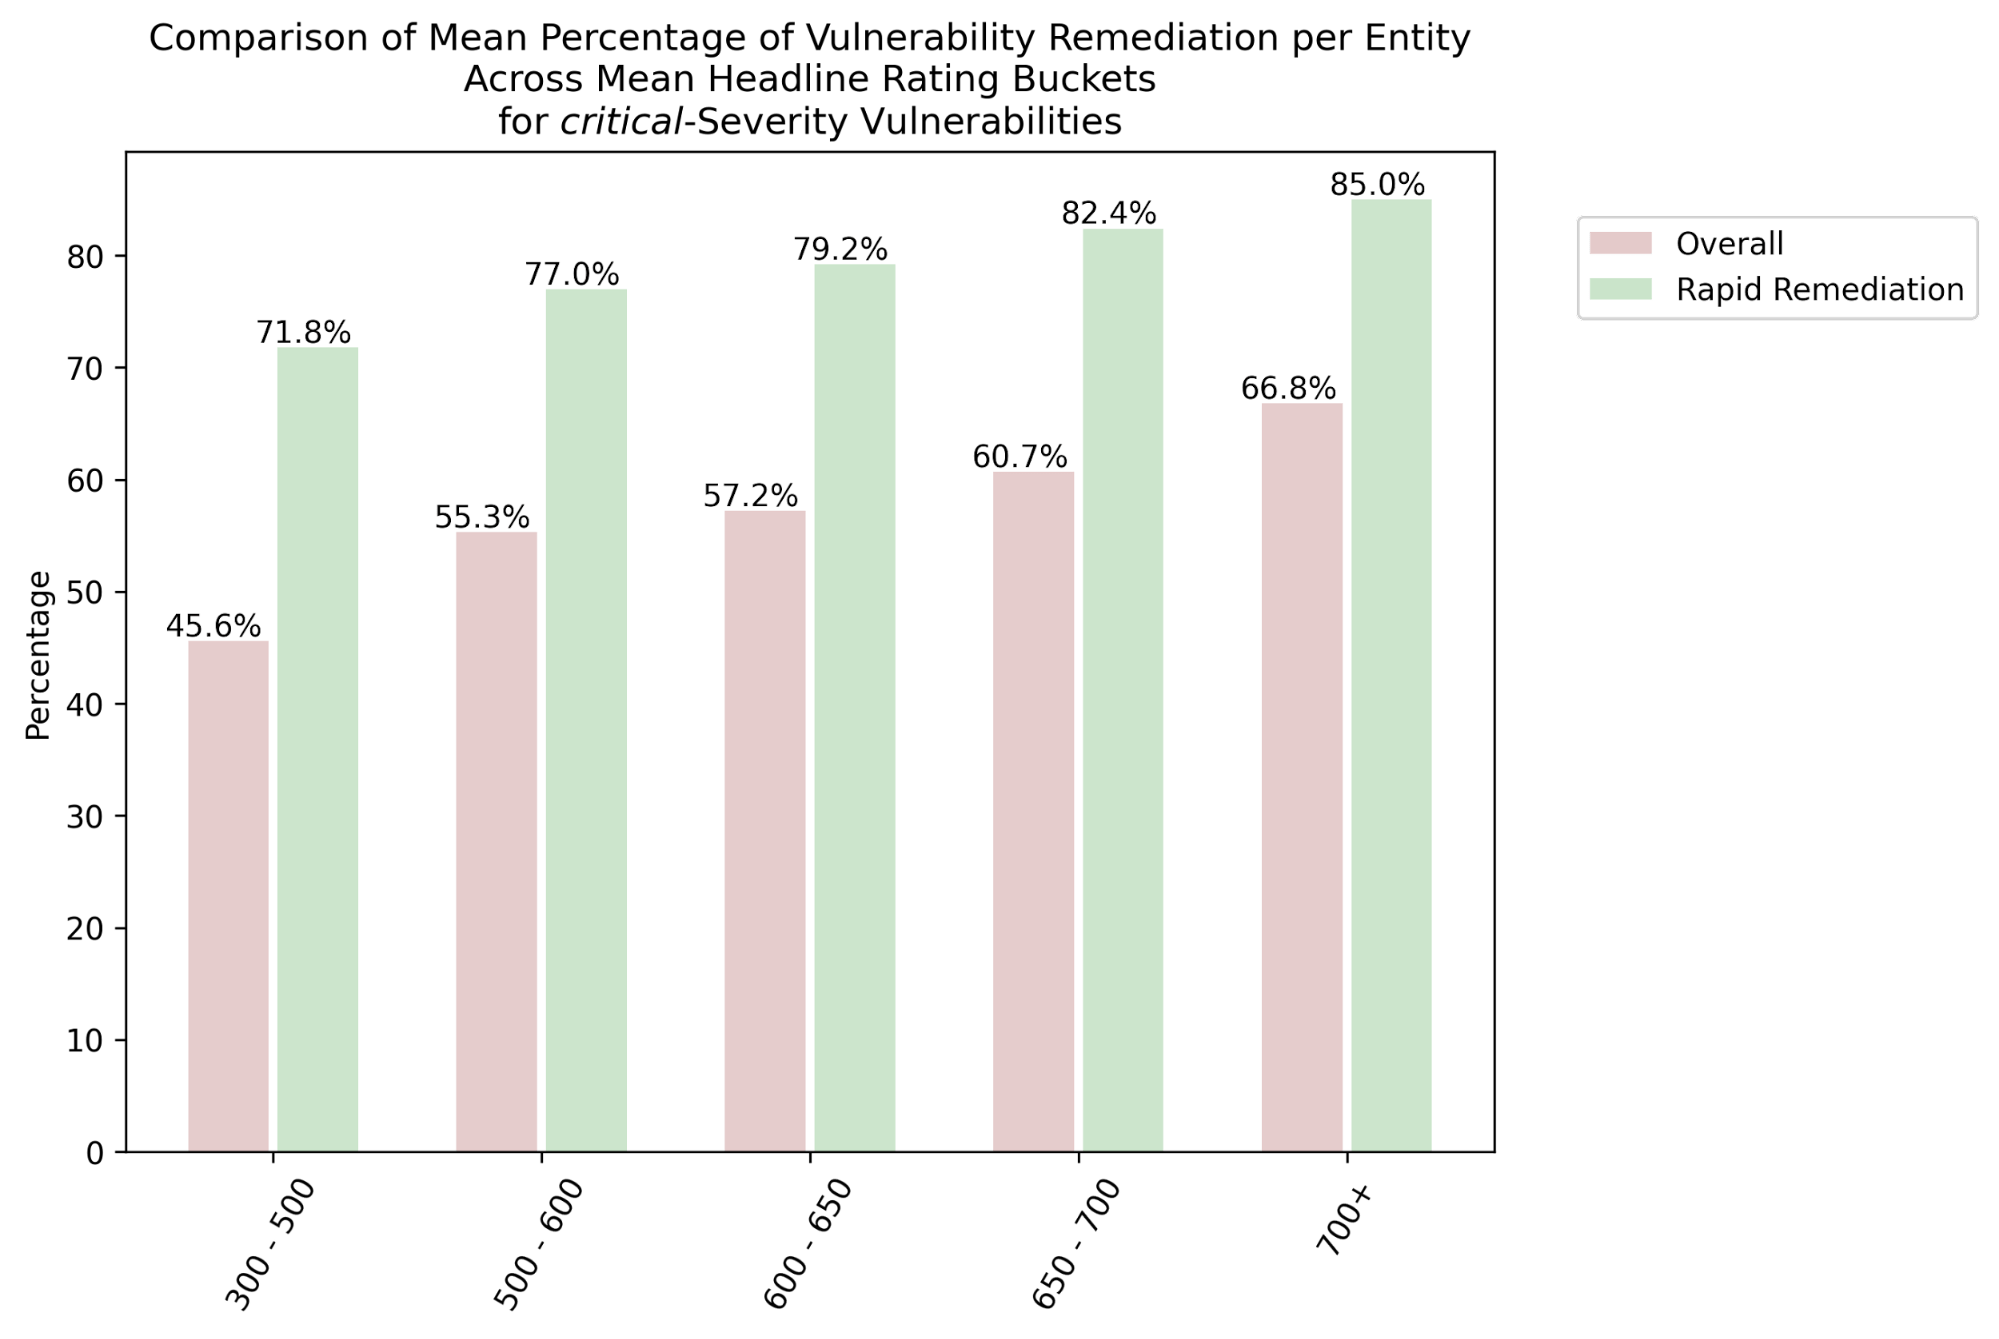
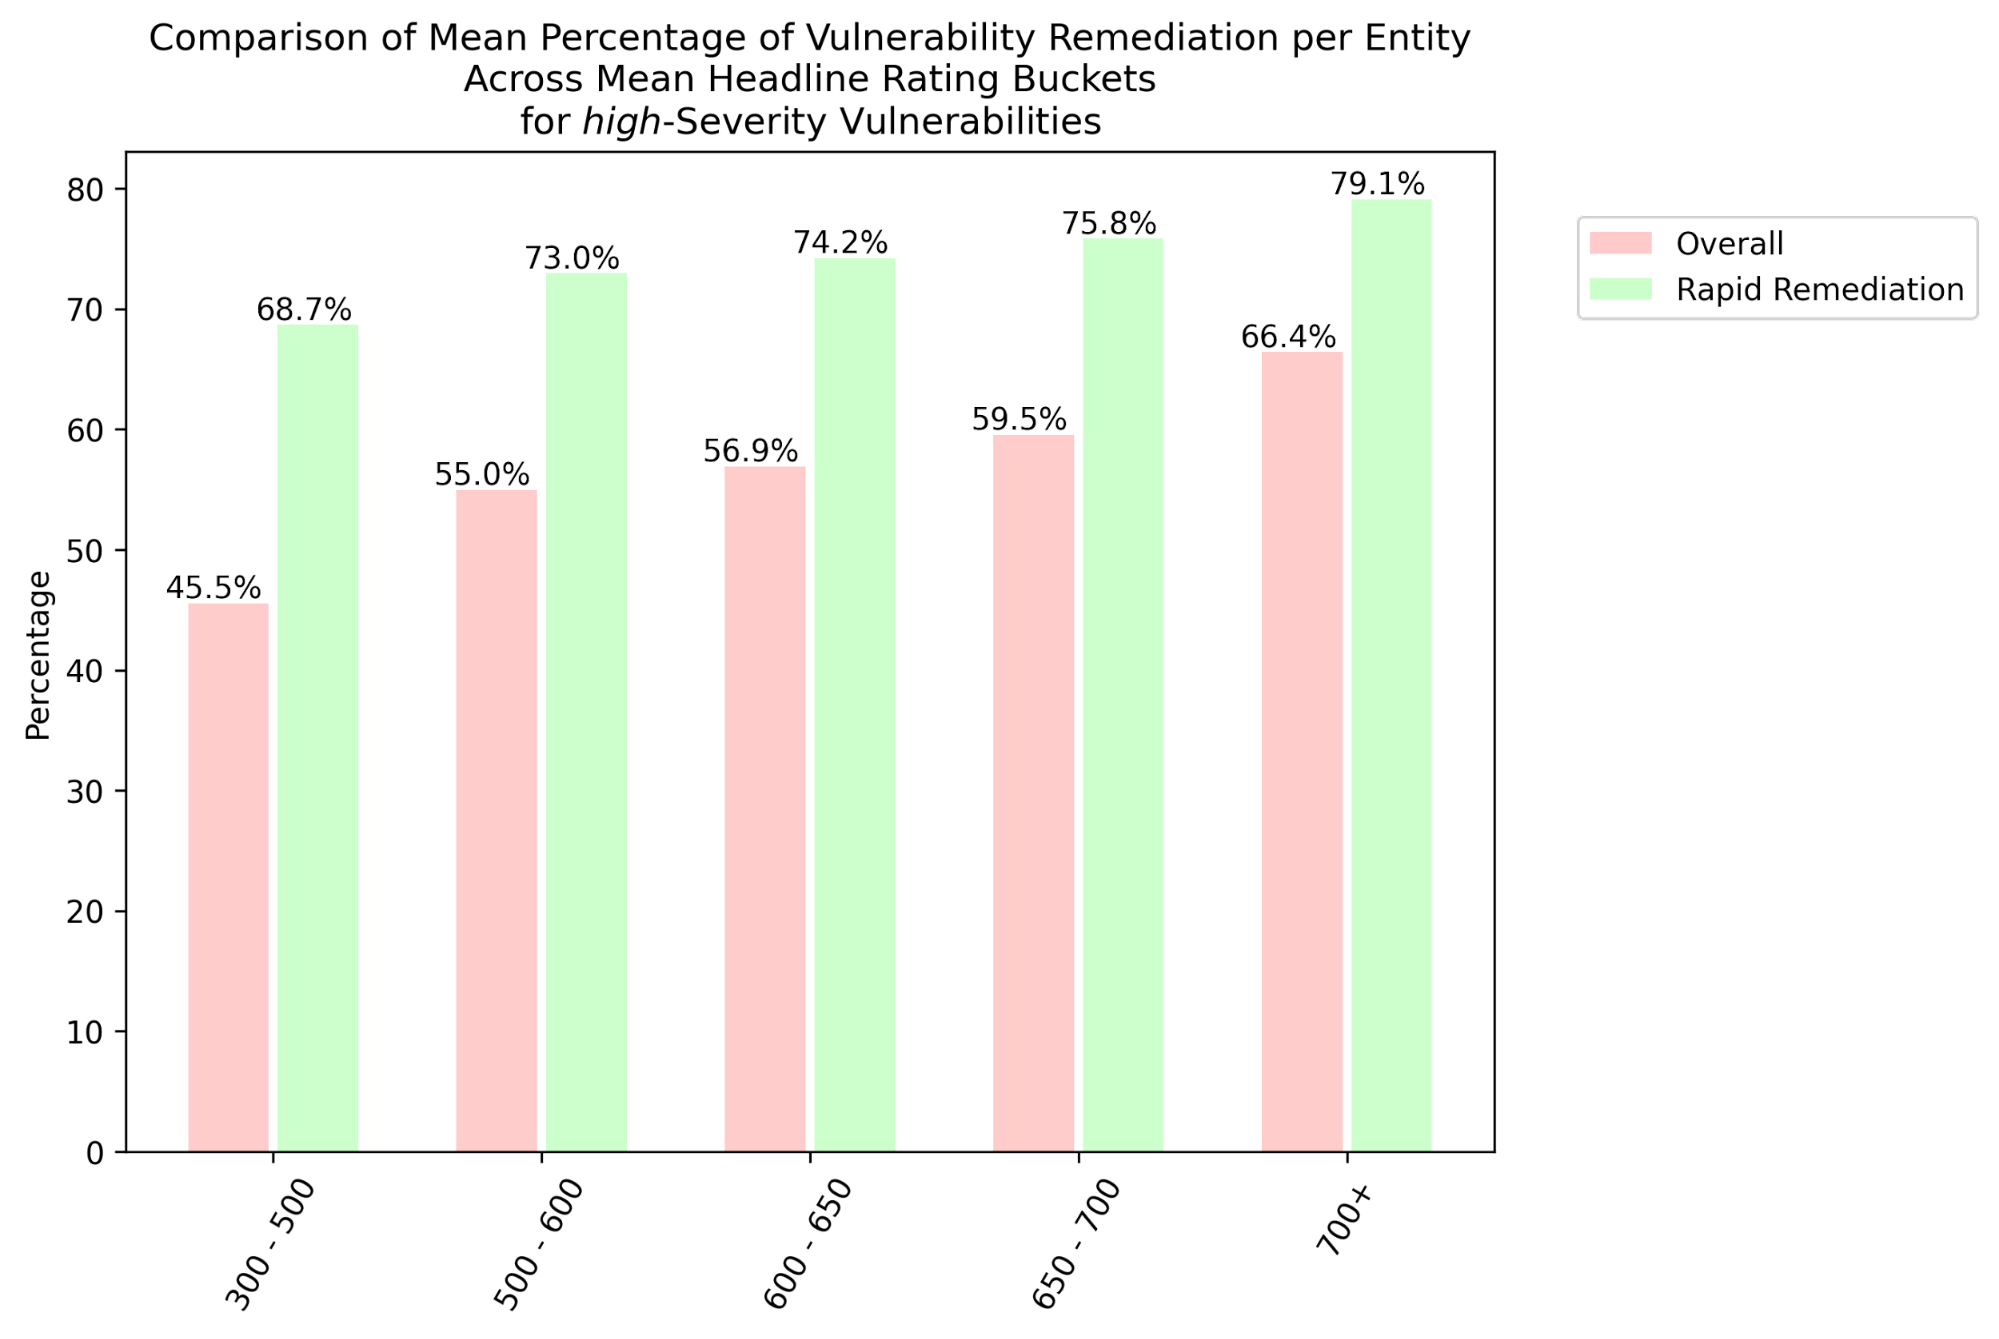
Figure 3 Mean Enterprise-Level Remediation Proportions of Detected Vulnerabilities Across Bitsight Headline Rating Ranges with Differentiation of Rapid Remediation from Overall Remediation for critical (Top) and high (Bottom) Severities
Mean remediation times15 for critical and high vulnerabilities combined, as presented in Figure 4, can be another useful measure of remediation responsiveness for comparing overall vs. rapid cases. Enterprises with <1,000 and 1,000+ personnel are treated separately. The larger organizations, with their larger footprint of digital assets, may take between 8% and 45% longer to perform remediation than smaller organizations. Leaders in terms of mean remediation times, who also tend to have higher Bitsight ratings in general, outperform the laggards with lower ratings.
Organizations with 700+ Bitsight ratings tend to be 1.4x to 1.5x faster with their overall remediation times vs. those in the 300-500 category. In the case of rapid remediation, the outperformance is 1.4x to 1.7x. In other words, enterprises with a low Bitsight rating would be less prepared to mitigate rapid remediation emergencies brought on by some high-impact incidents, such as zero-day issues.
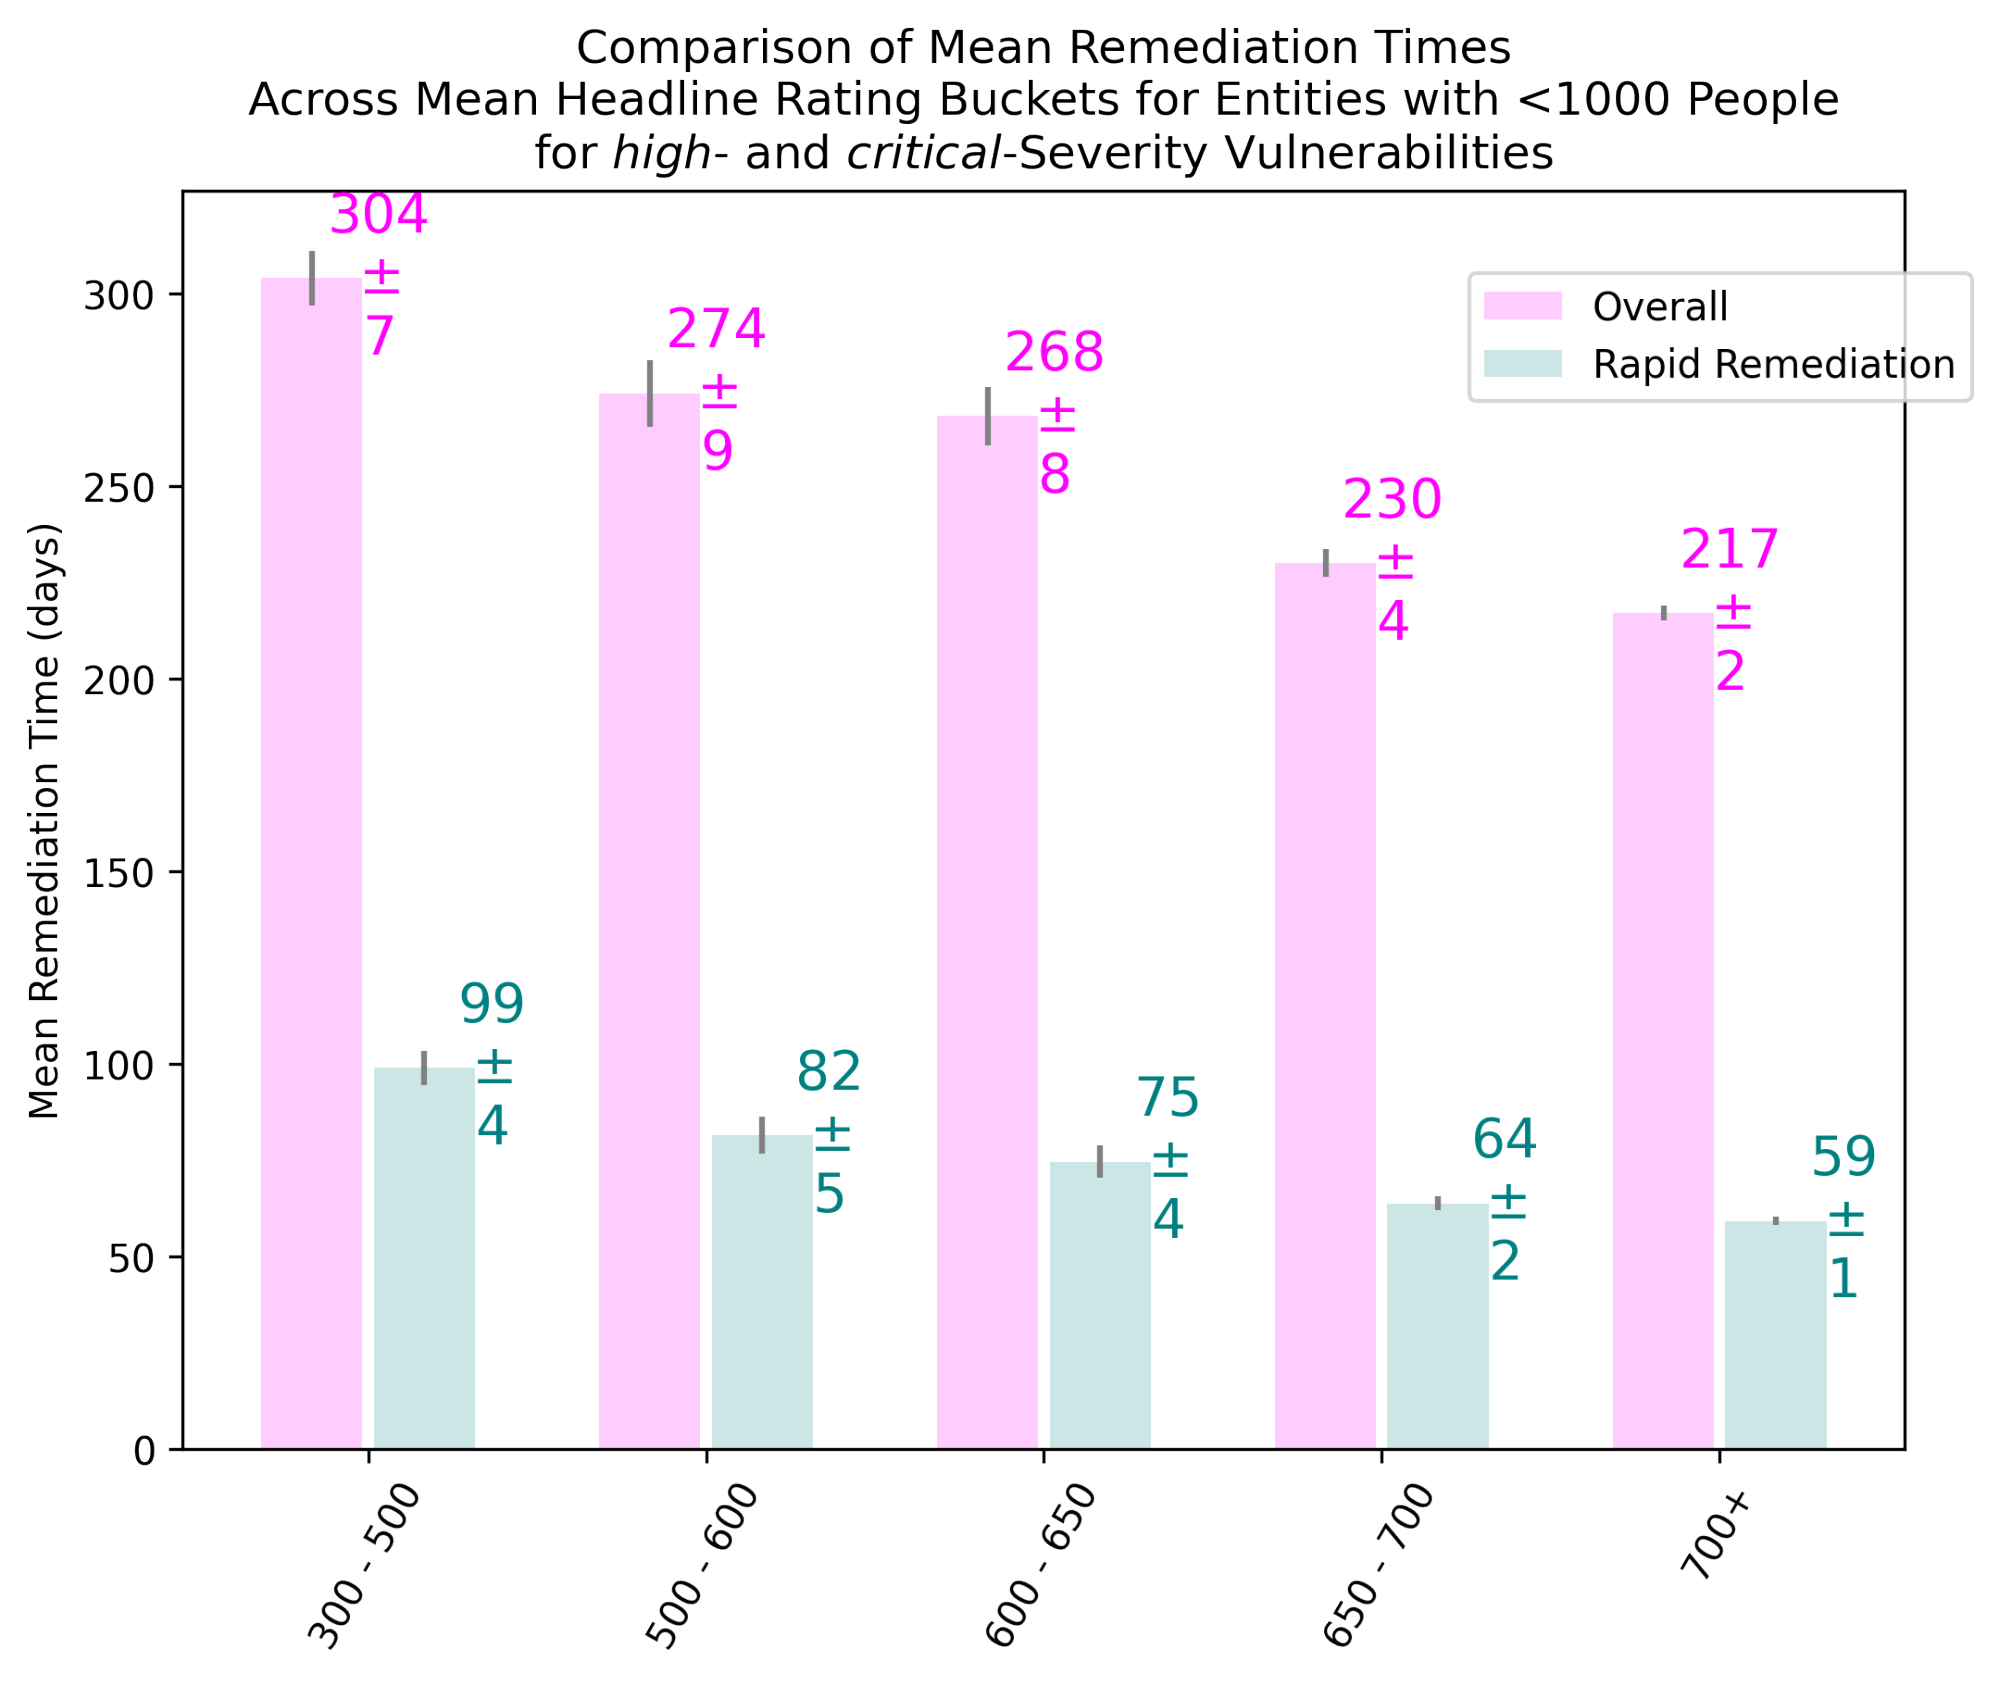
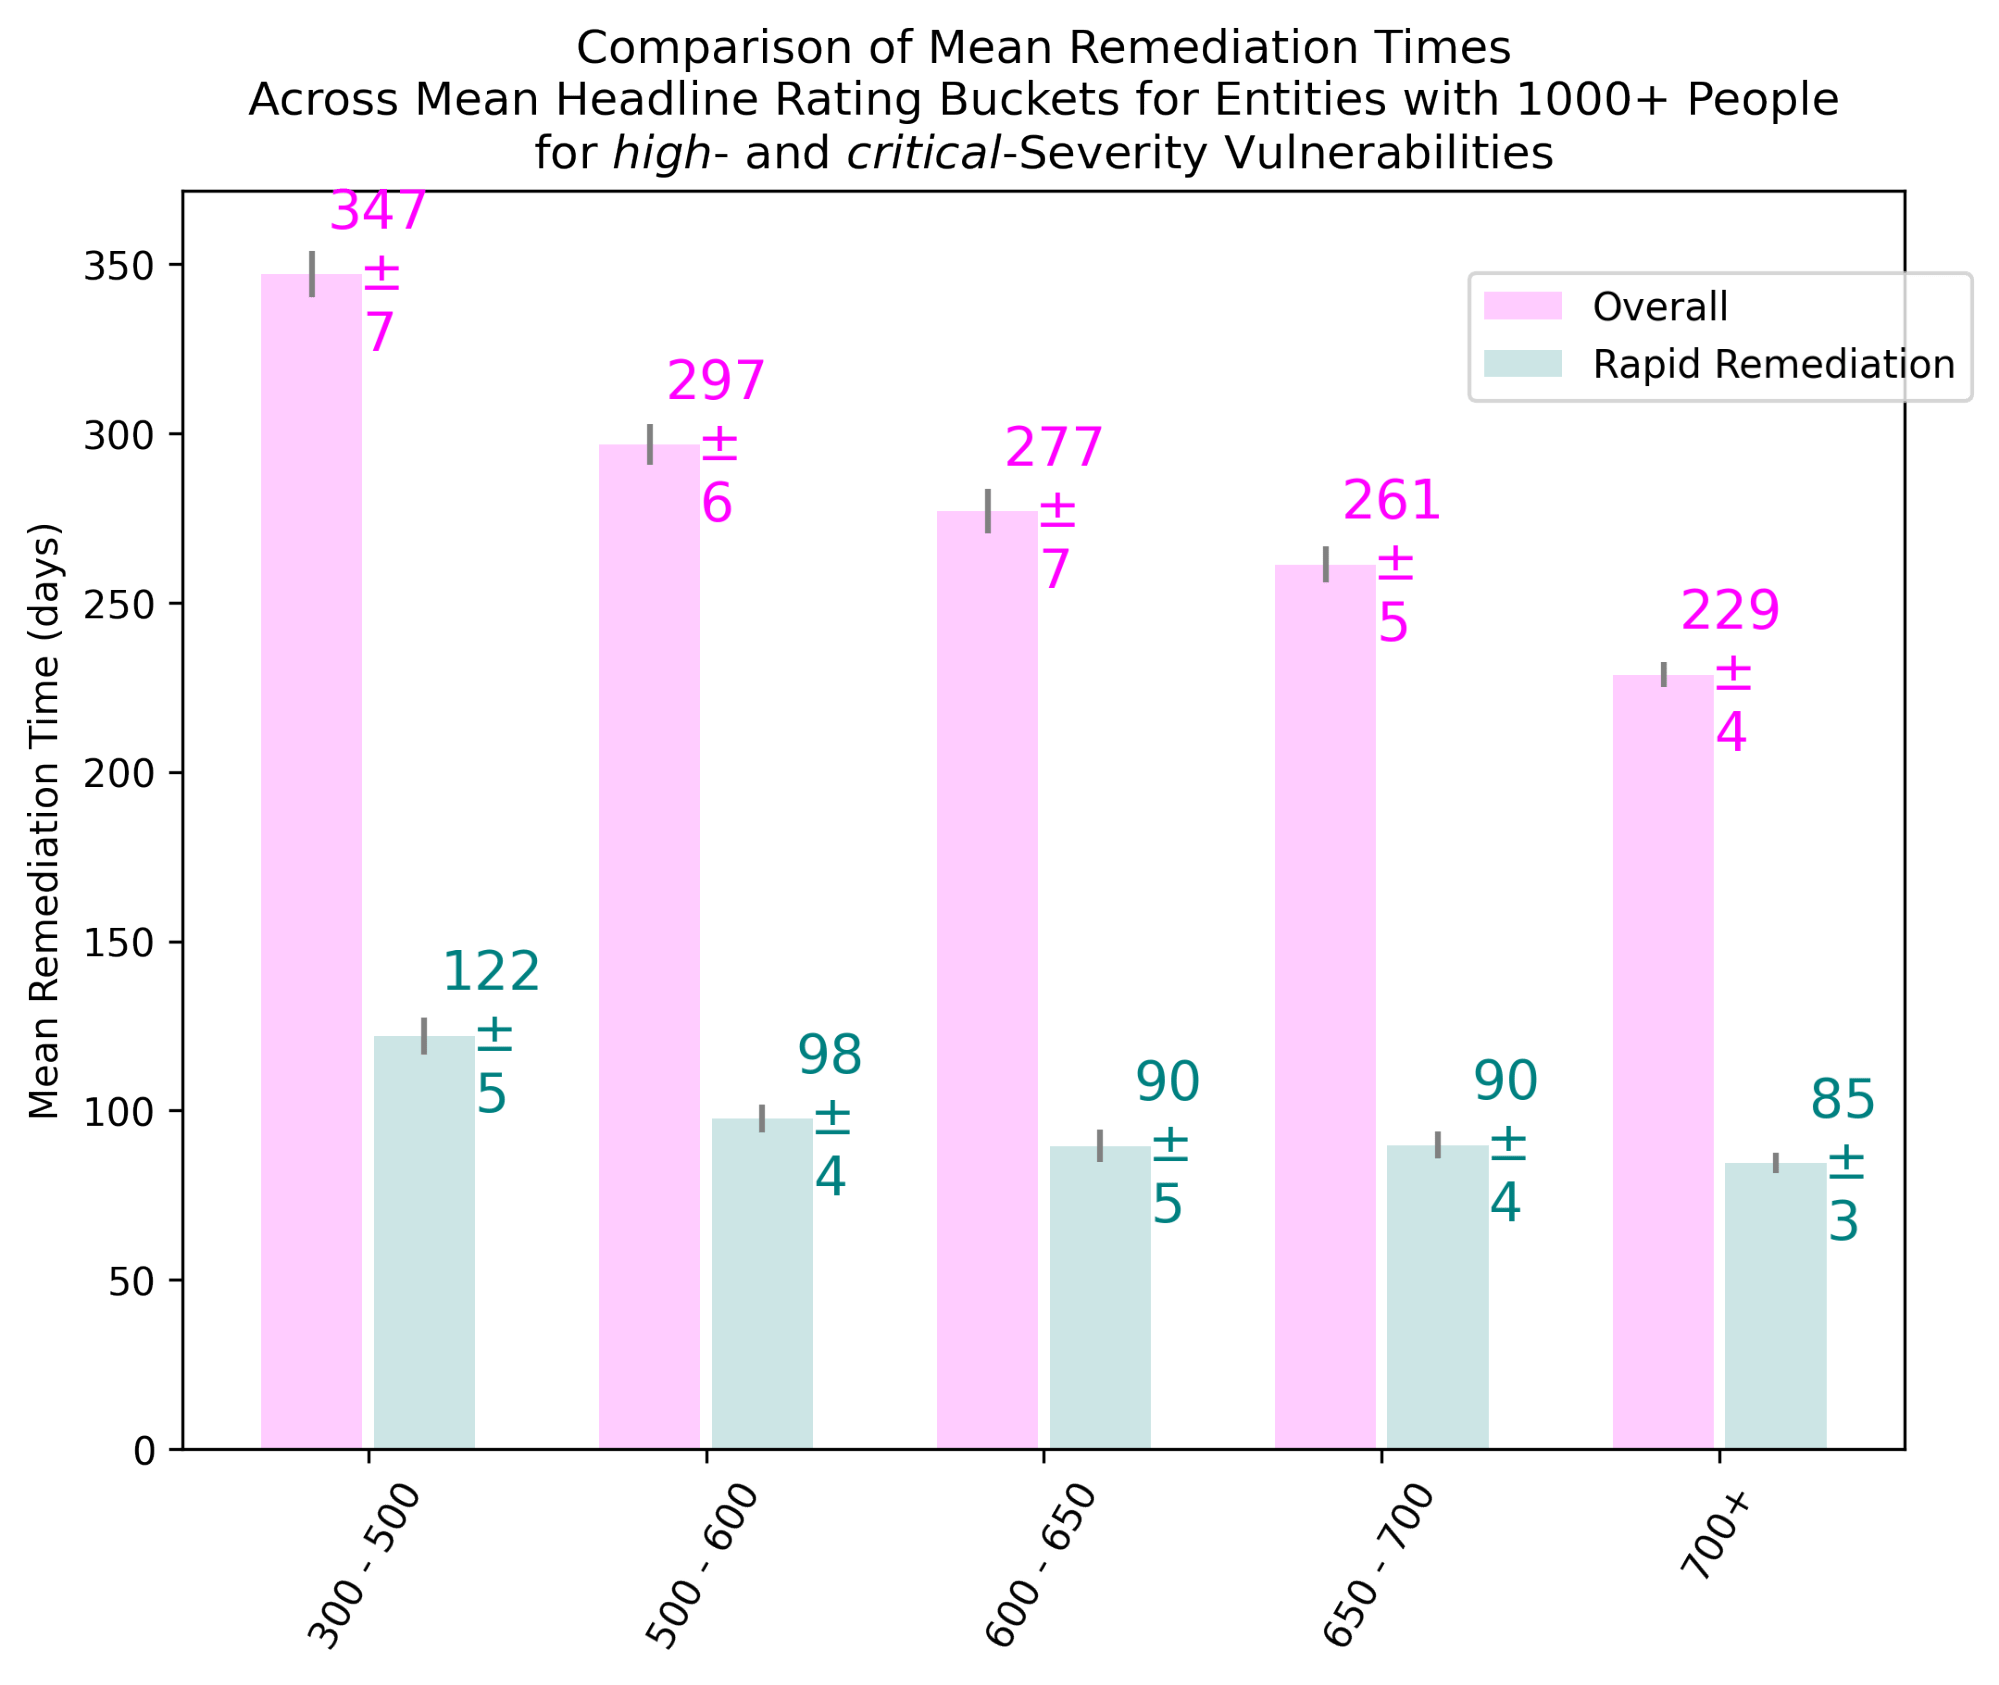
Figure 4 Mean Remediation Times for Vulnerabilities Across Bitsight Headline Rating Ranges with Differentiation of Rapid Remediation from Overall Remediation for Entities with <1,000 (Top) and 1,000+ (Bottom) Personnel
A quick synopsis is as follows:
- Enterprises with higher Bitsight headline ratings tend to respond more thoroughly and more quickly to vulnerabilities.
- Ratings of 700+ are associated with roughly 1.5x better performance vs. ratings in the 300-500 range in terms of overall remediation comprehensiveness. Remediation comprehensiveness is conspicuously boosted, across all rating ranges, for rapid remediation, but enterprises rated 700+ still maintain a 1.2x to 1.7x superiority over those rated 300-500.
- Remediation times for organizations with 700+ ratings can be 1.4x to 1.7x better than those rated 300-500.
|
|
|
|
|
|
|
|
|
Rapid Remediation of Vulnerabilities is Accompanied by Persistence on Social Media Discussions
As evidenced by the correlation between rapid remediation and CISA briefings discussed earlier, the timely dissemination of information on vulnerabilities can be of great significance. To this end, data from the social media platform Twitter was scoured for emerging vulnerabilities. Vulnerabilities discussed on Twitter were found to be 2.7x16 more likely to exhibit rapid remediation than ones not mentioned. Therefore, social media can serve as a useful tool to create awareness of – and coordinate remediation efforts for – vulnerabilities.
Figure 5 presents scatter plots of mean remediation times as a function of the number of days observed on Twitter, augmented with box plots of the x- and y-axis data by category. For vulnerabilities with high severity, the median of the typical mean remediation time is 5.33 months vs. 1.92 for rapid remediation. For critical vulnerabilities, the analogous values are 7.82 and 3.46 months, respectively. Interestingly, both typical and rapid remediation vulnerabilities of high severity spend a median of 9 days on Twitter, but for critical vulnerabilities, the typical remediation median of 10 days on Twitter is substantially superseded by 125 days for rapid remediation. It is, therefore, possible that Twitter discussions on critical vulnerabilities subject to rapid remediation persist even after most enterprises have patched them.
Scatter Plots of All Vulnerabilities (Top Left), Box Plots of Mean Remediation Times (Top Right), and Box Plots of Longevity on Twitter (Bottom)
The following takeaways emerge:
- Discussion on the social media platform Twitter impacts vulnerability remediation positively, boosting the likelihood of rapid remediation 2.7x.
- Vulnerabilities associated with rapid remediation tend to have
- Mean remediation times: the median of this is shortened 2.3x for high severity and 2.8x for critical, and
- No appreciable change in the median number of days on Twitter discussions for high severity, but a 12.5x boost (to 125 days from just 10) for critical ones.
Recommendations – Improving Cybersecurity Postures, Strategic Authoritative Briefings, and Sustained Social Media Coverage for Key Vulnerabilities
Analysis of Bitsight’s Internet-scale data on software vulnerabilities identified two distinct categories of remediation: typical and rapid. In typical remediation, only about 5% of affected enterprises resolve their vulnerabilities on a compounding monthly basis. Rapid remediation, which usually involves highly-publicized and/or high-impact issues, tends to produce more comprehensive resolution over appreciably shorter times.
Enterprises with higher Bitsight ratings – which are designed to be indicators of the cybersecurity postures of their respective organizations – are observed to be more competent in resolving vulnerabilities, both for typical and rapid remediation. In other words, organizations can be better prepared for vulnerability remediation by taking their cybersecurity posture (in all areas!) seriously, and taking steps to strengthen it.
Further, strategic coverage of vulnerabilities in CISA briefings (Alerts and Current Activity advisories) can accelerate the pace of their remediation, boosting the probability of rapid remediation by around 4.7x. Even greater impacts may be possible, which would be highly desirable. Sustained coverage of vulnerabilities on social media, e.g. Twitter, is associated with boosting their prospects of rapid remediation by roughly 2.7x.
1 In essence, a compound remediation rate is like a compound interest rate, but the affected entity count (i.e. the analog of the principal) decreases at every compounding period. Thus, for the model developed, the remediation rate constitutes a negative rate of compounding. Also, the compounding period is infinitesimally small. If the compounding/remediation were held constant over a whole month (instead of being allowed to be updated every infinitesimal instant), 5% of the entities with vulnerability at the start of that period of one month would have had their vulnerability resolved.
2 The few data points exhibiting complete remediation (i.e., 0% of entities still affected) have been excluded from regression analysis.
3 The process consists of applying Linear Regression upon taking the respective natural logarithm of both the x- and y-coordinates (zero values excluded). This is a well-known strategy for exploiting Linear Regression tools to build models for exponential behavior, and may be described as a “Log-Log Linear Regression”.
4 Since the underlying technique is Linear Regression, it is possible to compute the familiar R2 metric on the transformed coordinates. In this case, R2log-log = 0.97, indicating a high-quality fit in the log-log, i.e. transformed, coordinate space. However, usage of R2 would be statistically inappropriate in the non-transformed coordinates. The Root Mean Squared Error (RMSE), in the non-transformed coordinate space, is used as a guide instead.
5 For high and critical, respectively: R2log-log values are 0.80 and 0.79, while RMSE values are 14.63% and 16.53%.
6 Points with coordinates (x, y) are expected to lie within the 95% confidence interval of the medium regression trendline ŷ (medium) (x) = y0 e - k x if y is within ŷ (medium) (x) ± 2 ⨯ RMSE (medium).
In this case, the RMSE is an estimator of the standard deviation from the estimated regression values, and can be used to define the 95% confidence interval (cf., for example, p. 92 of the following reference: National Research Council. 1991. Improving Information for Social Policy Decisions -- The Uses of Microsimulation Modeling: Volume I, Review and Recommendations. Washington, DC: The National Academies Press. https://doi.org/10.17226/1835). Therefore, high and critical data points lying below the line y = ŷ (medium) (x) - 2 ⨯ RMSE (medium) are considered to be exhibiting remediation at rates notably faster than the limiting trendline, providing a definition of the Rapid Remediation regions shaded green in Figure 2.
7 For high and critical, respectively: R2log-log values are 0.95 and 0.91, while RMSE values are 8.59% and 8.07%.
8 Cf. entries in Table A.1 marked with an asterisk (*).
9 Popular containerization solution for DevOps scaling
10 Forms the basis of numerous web applications
11 Widely used virtual machine (VM) platform
12 Popular video conferencing tool; made especially relevant by the prevalence of remote work in response to the advent of the COVID-19 pandemic
13 Bitsight “Ratings” discussed here exclude contributions of the Patching Cadence risk vector. This exclusion is necessary to avoid making a tautological argument, as Patching Cadence seeks to make direct measurements of remediation times for vulnerabilities.
14 Combination of typical and rapid remediation categories
15 Error bars indicate the estimated 95% confidence intervals.
16 Vulnerabilities seen on Twitter had a 38.2% (= 21 / 55) probability of rapid remediation compared to 14.1% (= 12 / 85) for those not seen.
17 Shortening of the remediation times would be an obvious – and defining – characteristic of rapid remediation vulnerabilities. It is especially instructive to note that the shortening is on a significant scale (on the order of 2x). However, this salience is difficult to process visually from scatter-plotted data in Figure 5 without the aid of the adjoining box plots.
18 Shortening of the remediation times would be an obvious – and defining – characteristic of rapid remediation vulnerabilities. It is especially instructive to note that the shortening is on a significant scale (on the order of 2x). However, this salience is difficult to process visually from scatter-plotted data in Figure 5 without the aid of the adjoining box plots.