
All Global Observations Footprint

Top 10 Identified Countries

Country Observations Percentage
US 331,350,361 46.08%
DE 68,539,832 9.53%
CN 29,292,139 4.07%
FR 25,768,155 3.58%
NL 23,569,400 3.28%
JP 19,789,853 2.75%
CA 19,289,516 2.68%
GB 19,260,967 2.68%
RU 15,849,182 2.20%
IT 10,320,144 1.44%

All Industry Observations Footprint

Top 10 Identified Industries

*Service provider organizations (typically Technology and Telecommunications) are disproportionally represented in the results given their upstream ownership of end-user infrastructure. See our FAQs.

Industry* Observations Percentage
Technology 740,730,604 88.85%
Telecommunications 42,160,459 5.06%
Finance 20,339,830 2.44%
Business Services 8,545,710 1.03%
Government/Politics 3,751,588 0.45%
Education 3,621,924 0.43%
Engineering 3,010,782 0.36%
Consumer Goods 2,212,740 0.27%
Utilities 2,146,060 0.26%
Manufacturing 1,560,193 0.19%

Browse Software by Vendors or their Products

Click a Vendor or Product name below. 

876 Vendors Found
Vendor Observations Sort ascending
Sophos 35,600
Philips 35,273
Xenforo 34,578
SPIP 34,518
Statamic 34,356
SolarWinds 33,787
Limitloginattempts 32,378
Pimcore 32,036
Project Jupyter 31,235
Redmine 31,077
Mort Bay 30,938
8x8 30,295
NLnet Labs 30,222
Alt-N 29,785
DokuWiki 29,385
bbPress 29,178
Webmin 29,150
Nextendweb 28,839
Paessler AG 28,784
Public Knowledge Project 28,348
15636 Products Found
Product Vendor Observations Sort ascending
Gq65q70tgtxzg Samsung 1
Qa85ls03basxnz Samsung 1
Ls32am500nnxza Samsung 1
Qe50q60dauxua Samsung 1
Sp Lsp9tjax Samsung 1
Ue58tu7100uxua Samsung 1
Qa65qn87dakxxs Samsung 1
Qe43qn90datxxn Samsung 1
Qe65q77aatxxn Samsung 1
Un55bu8000kxzl Samsung 1
Un55tu7000fxzx Samsung 1
Ua75cu8000wxxy Samsung 1
Ue49mu6179 Samsung 1
Ue50du7100uxua Samsung 1
Ue32t5372cdxzt Samsung 1
Ue43tu8500uxzt Samsung 1
Ua55ru7300kxxv Samsung 1
Ue55cu7090uxzt Samsung 1
Un70du7700gxzd Samsung 1
Qe75q74batxxn Samsung 1

The leading provider of Cyber Risk Intelligence solutions, Bitsight introduced the next-generation internet scanning Bitsight Groma in May 2024. This technology continuously scans the entire internet to discover assets, collect asset attribution evidence, and identify an ever-growing set of security observations, such as vulnerabilities and misconfigurations.  Groma’s scanning activities presently encompass:


  • 40 million-plus monitored organizations
  • 250 million-plus host names
  • 4 billion-plus routable IPv4 and IPv6 addresses

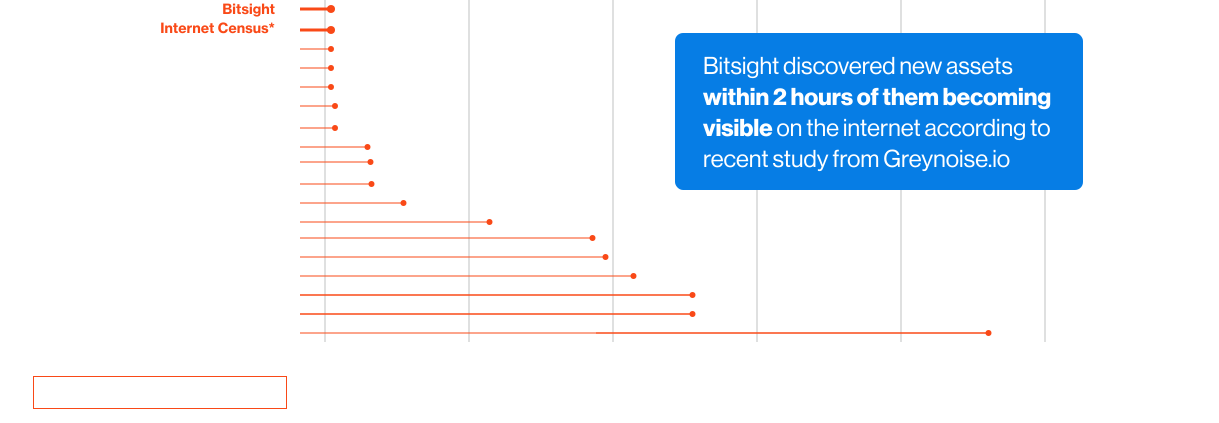
Greynoise’s recent study testifies the speed of Bitsight Groma.
Bitsight data discovery
Governance charcoal background

Bitsight TRACE team investigates security incidents and identifies vulnerabilities and threats.

View latest security research 

See what you’re up against across the expanding attack surface. Prioritize what matters most. And mitigate where you’re most vulnerable.

External Attack Surface Management

Software Vulnerabilities

The Dynamic Vulnerability Exploit (DVE) score, powered by Bitsight AI, reflects the probability of a vulnerability being exploited by malicious actors over the course of 90 days.

This is a stack-based buffer overflow in Ivanti Connect Secure, Ivanti Policy Secure, and Ivanti Neurons for ZTA gateways, which allows unauthenticated attackers to achieve remote code execution. PoCs are available for CVE-2025-0282, which has been actively exploited in the wild. Bitsight also detected at least one threat actor attempting to sell a PoC for CVE-2025-0282.

This vulnerability allows authentication bypass using an alternate path or channel, which a remote attacker could leverage to gain super-admin privileges via crafted requests to the Node.js websocket module. It affects FortiOS version 7.0.0 through 7.0.16 and FortiProxy version 7.0.0 through 7.0.19 and 7.2.0 through 7.2.12.

This is a privilege escalation vulnerability in Palo Alto Networks PAN-OS software that has been actively exploited in the wild.

exposure management-easier reporting

While Groma provides visibility into public-facing technologies and vulnerabilities across the Internet, the bigger question is what those signals mean for your organization.

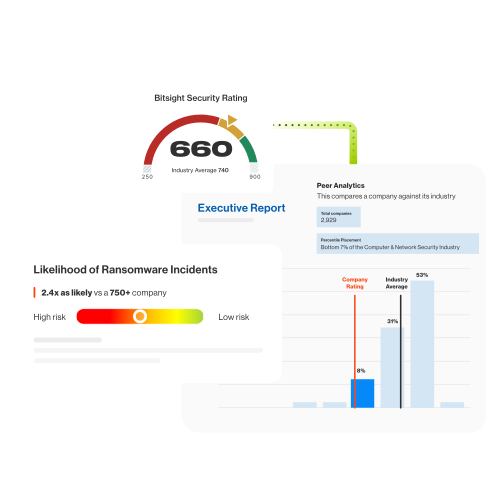
Get your free customized cyber risk report to see key indicators tied to your company’s security posture, incident likelihood, and performance over time.