Browse Software by Vendors or their Products
Click a Vendor or Product name below.


| Vendor | Observations Ordenar ascendente |
|---|---|
| Yiiframework | 18,932 |
| Wind River | 18,904 |
| Oscommerce | 18,863 |
| Drupal | 18,848 |
| SMA | 18,807 |
| Haproxy | 18,547 |
| King Theme | 18,501 |
| WebFactory Ltd | 18,188 |
| WP Time Capsule | 18,118 |
| OptinMonster | 17,855 |
| Sentry | 17,762 |
| ConnectWise | 17,533 |
| Tableau | 17,432 |
| Openwebui | 17,369 |
| Azerion | 17,183 |
| Flarum | 16,814 |
| Web2py | 16,716 |
| TP-Link | 16,538 |
| Pterodactyl | 16,200 |
| Loginizer | 15,415 |
| Product | Vendor | Observations Ordenar ascendente |
|---|---|---|
| Tq55q64cauxxc | Samsung | 11 |
| Tq65q74dbtxxc | Samsung | 11 |
| Tu43cu7105kxxc | Samsung | 11 |
| Tu43du7105kxxc | Samsung | 11 |
| Tu50du7175uxxc | Samsung | 11 |
| Tz 270w | SonicWall | 11 |
| Ue32j6200 | Samsung | 11 |
| Ue32t5300auxua | Samsung | 11 |
| Ue40ku6000 | Samsung | 11 |
| Ue43ku6075 | Samsung | 11 |
| Ue43ru7415uxxc | Samsung | 11 |
| Ue43tu7022kxxh | Samsung | 11 |
| Ue43tu8502uxxh | Samsung | 11 |
| Ue43tu8515uxxc | Samsung | 11 |
| Ue49ls03n | Samsung | 11 |
| Ue50hu6900 | Samsung | 11 |
| Ue50mu6192 | Samsung | 11 |
| Ue55cu8002kxxh | Samsung | 11 |
| Ue55du7192uxxh | Samsung | 11 |
| Ue55js8000 | Samsung | 11 |
The leading provider of Cyber Risk Intelligence solutions, Bitsight introduced the next-generation internet scanning Bitsight Groma in May 2024. This technology continuously scans the entire internet to discover assets, collect asset attribution evidence, and identify an ever-growing set of security observations, such as vulnerabilities and misconfigurations. Groma’s scanning activities presently encompass:
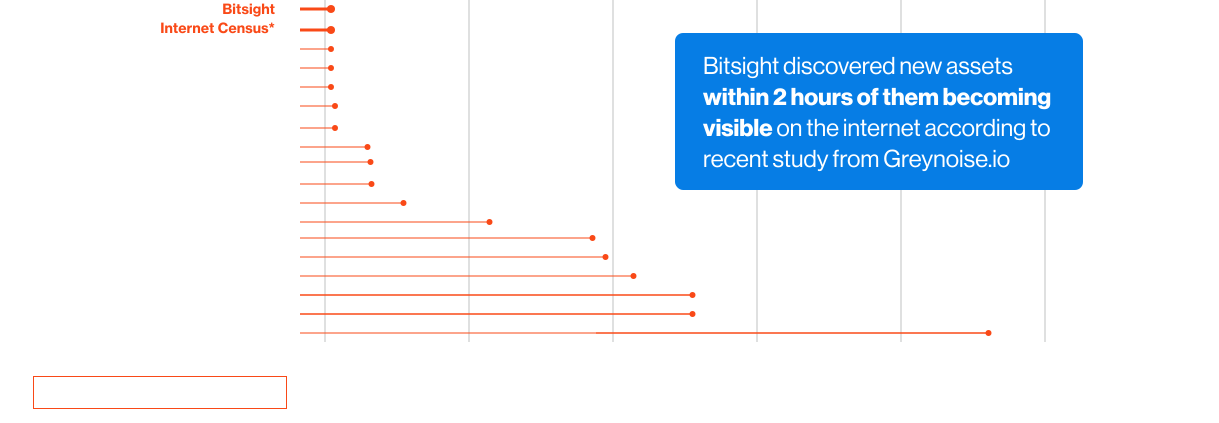
Greynoise’s recent study testifies the speed of Bitsight Groma.

The Dynamic Vulnerability Exploit (DVE) score, powered by Bitsight AI, reflects the probability of a vulnerability being exploited by malicious actors over the course of 90 days.
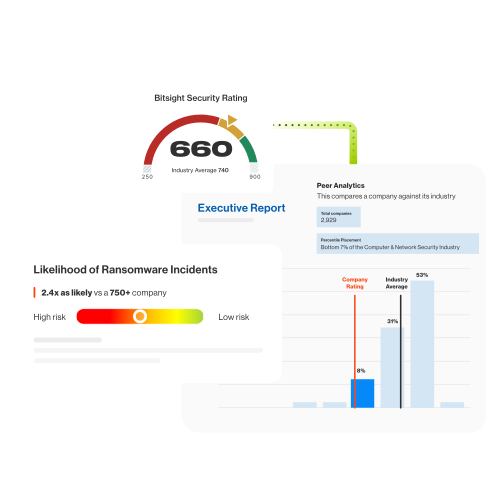
While Groma provides visibility into public-facing technologies and vulnerabilities across the Internet, the bigger question is what those signals mean for your organization.
Get your free customized cyber risk report to see key indicators tied to your company’s security posture, incident likelihood, and performance over time.