Groma Explorer

All Global Observations Footprint

Top 10 Identified Countries

Country Observations Percentage
US 329,744,260 46.07%
DE 68,394,842 9.56%
CN 29,113,298 4.07%
FR 25,701,035 3.59%
NL 23,497,550 3.28%
JP 19,672,575 2.75%
CA 19,208,653 2.68%
GB 19,156,911 2.68%
RU 15,780,698 2.20%
IT 10,266,851 1.43%

All Industry Observations Footprint

Top 10 Identified Industries

*Service provider organizations (typically Technology and Telecommunications) are disproportionally represented in the results given their upstream ownership of end-user infrastructure. See our FAQs.

Industry* Observations Percentage
Technology 738,215,385 88.84%
Telecommunications 41,890,012 5.04%
Finance 20,379,508 2.45%
Business Services 8,547,233 1.03%
Government/Politics 3,749,848 0.45%
Education 3,616,282 0.44%
Engineering 3,012,380 0.36%
Consumer Goods 2,209,389 0.27%
Utilities 2,144,591 0.26%
Manufacturing 1,560,806 0.19%

Browse Software by Vendors or their Products

Click a Vendor or Product name below. 

890 Vendors Found
Vendor Observations Aufsteigend sortieren
Avaya 3,450
SugarCRM 3,347
Vaadin 3,296
ZK 3,293
Ez 3,280
Sftpgo Project 3,249
OpenSIPS 3,229
Terra-Master 3,163
KodCloud 3,162
Simple Help 3,131
RealVNC 3,122
Liferay 3,118
Aruba Networks 3,108
Observium 3,076
SalesAgility 3,074
Zend By Perforce 3,065
Deno 3,024
ServiceStack 3,001
Nginxui 2,994
Hpe 2,967
15580 Products Found
Product Vendor Observations Aufsteigend sortieren
Gaia Os Check Point 71,288
Disable Comments Project Disable Comments 70,954
Miniupnpd Miniupnp Project 70,561
Openclaw Openclaw 69,950
Mailchimp Ibericode 69,597
Wp Fastest Cache WP Fastest Cache 69,418
Wp Optimize Updraftplus 69,065
Comware H3c 66,671
Pfsense Electric Sheep Fencing 66,184
Autoptimize Autoptimize 65,882
Qts QNAP 65,805
Linux Red Hat 65,136
Photo Station QNAP 65,080
Nas QNAP 65,044
FastHTTP Fasthttp Project 63,807
Freepbx Sangoma 62,409
Ray Anyscale 61,941
Matomo Matomo 61,686
Comfyui Comfy 61,027
Mediawiki MediaWiki 60,421

The leading provider of Cyber Risk Intelligence solutions, Bitsight introduced the next-generation internet scanning Bitsight Groma in May 2024. This technology continuously scans the entire internet to discover assets, collect asset attribution evidence, and identify an ever-growing set of security observations, such as vulnerabilities and misconfigurations.  Groma’s scanning activities presently encompass:


  • 40 million-plus monitored organizations
  • 250 million-plus host names
  • 4 billion-plus routable IPv4 and IPv6 addresses

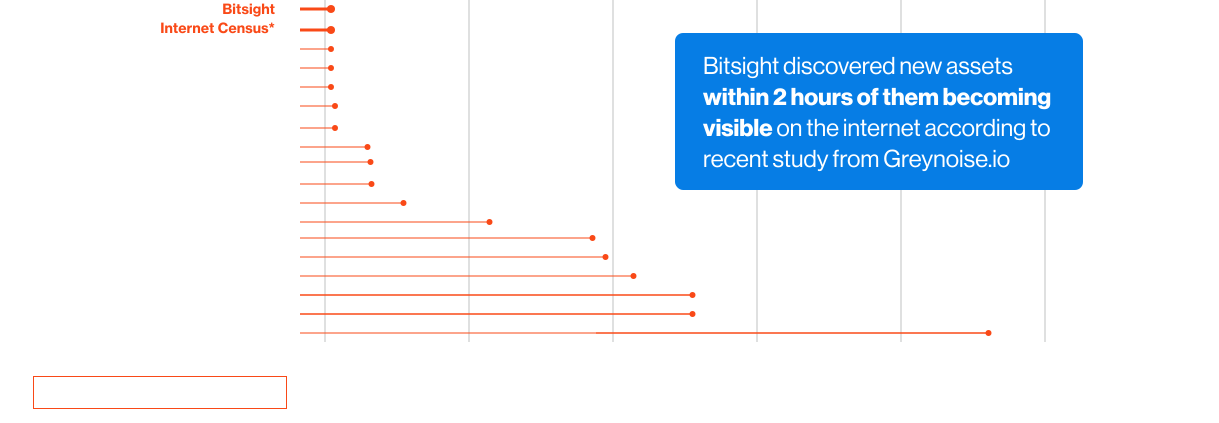
Greynoise’s recent study testifies the speed of Bitsight Groma.
Bitsight data discovery
Governance charcoal background

Bitsight TRACE team investigates security incidents and identifies vulnerabilities and threats.

View latest security research 

See what you’re up against across the expanding attack surface. Prioritize what matters most. And mitigate where you’re most vulnerable.

External Attack Surface Management

Software Vulnerabilities

The Dynamic Vulnerability Exploit (DVE) score, powered by Bitsight AI, reflects the probability of a vulnerability being exploited by malicious actors over the course of 90 days.

This is a stack-based buffer overflow in Ivanti Connect Secure, Ivanti Policy Secure, and Ivanti Neurons for ZTA gateways, which allows unauthenticated attackers to achieve remote code execution. PoCs are available for CVE-2025-0282, which has been actively exploited in the wild. Bitsight also detected at least one threat actor attempting to sell a PoC for CVE-2025-0282.

This vulnerability allows authentication bypass using an alternate path or channel, which a remote attacker could leverage to gain super-admin privileges via crafted requests to the Node.js websocket module. It affects FortiOS version 7.0.0 through 7.0.16 and FortiProxy version 7.0.0 through 7.0.19 and 7.2.0 through 7.2.12.

This is a privilege escalation vulnerability in Palo Alto Networks PAN-OS software that has been actively exploited in the wild.

exposure management-easier reporting

While Groma provides visibility into public-facing technologies and vulnerabilities across the Internet, the bigger question is what those signals mean for your organization.

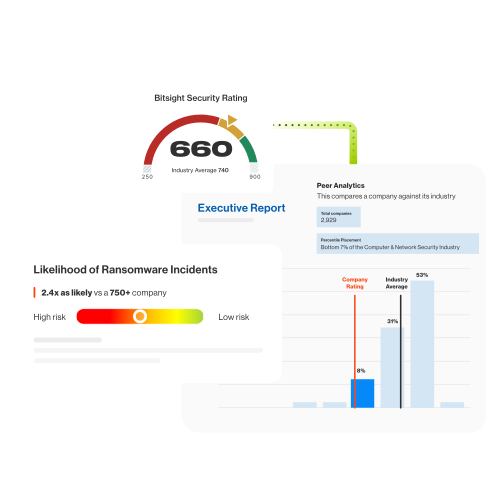
Get your free customized cyber risk report to see key indicators tied to your company’s security posture, incident likelihood, and performance over time.